Reports
- What the Reports Service Does
- Before You Start
- Reports UI Overview
- Create Your First Report
- Email Template and Export
- Triggers
What the Reports Service Does
The Kaa Reports service lets you collect platform data, format it into readable tables, and export it as:
PDFCSVExcel
Reports can include:
You choose both the data source and the time range.
Before You Start
To build a useful report, you need data in the platform first. For example:
- an application
- one or more endpoints
- recorded time-series data, metadata, alerts, or related assets
If you are unfamiliar with the setup process, see the Getting Started guide.
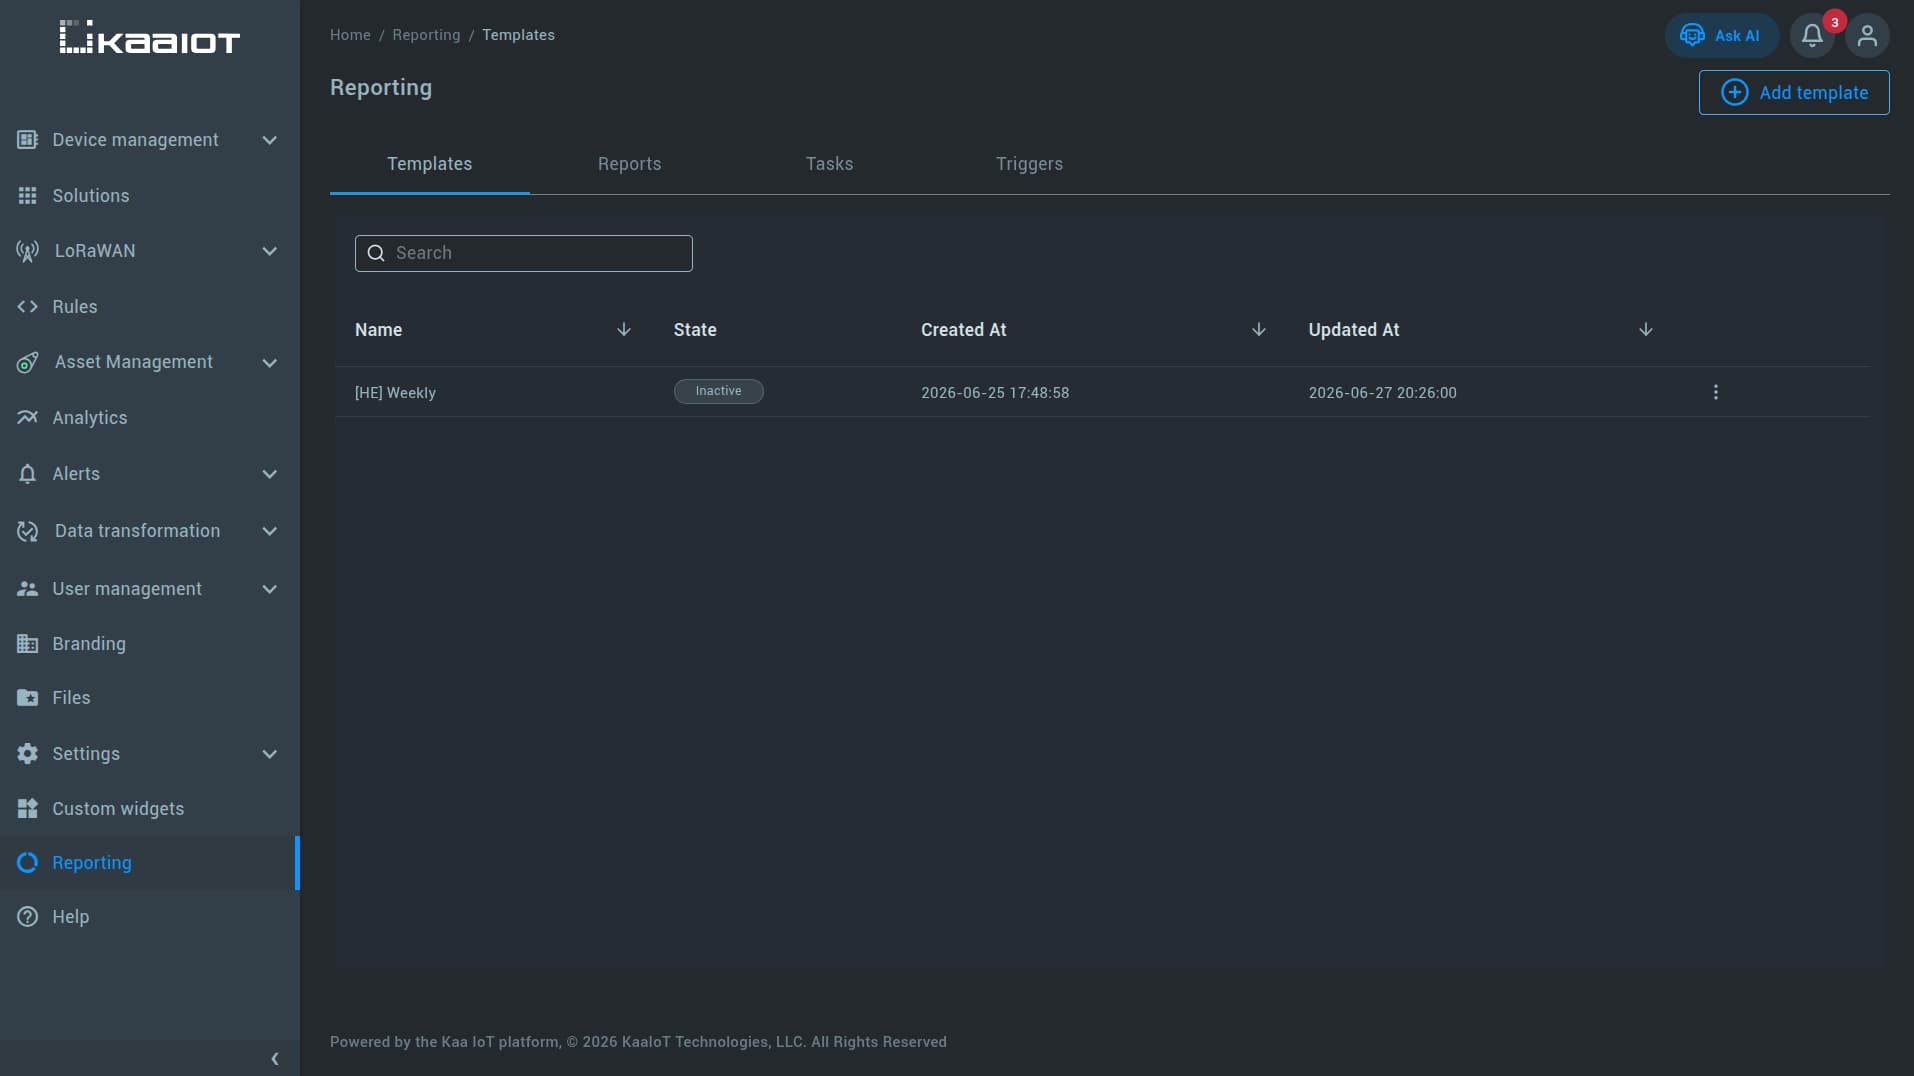
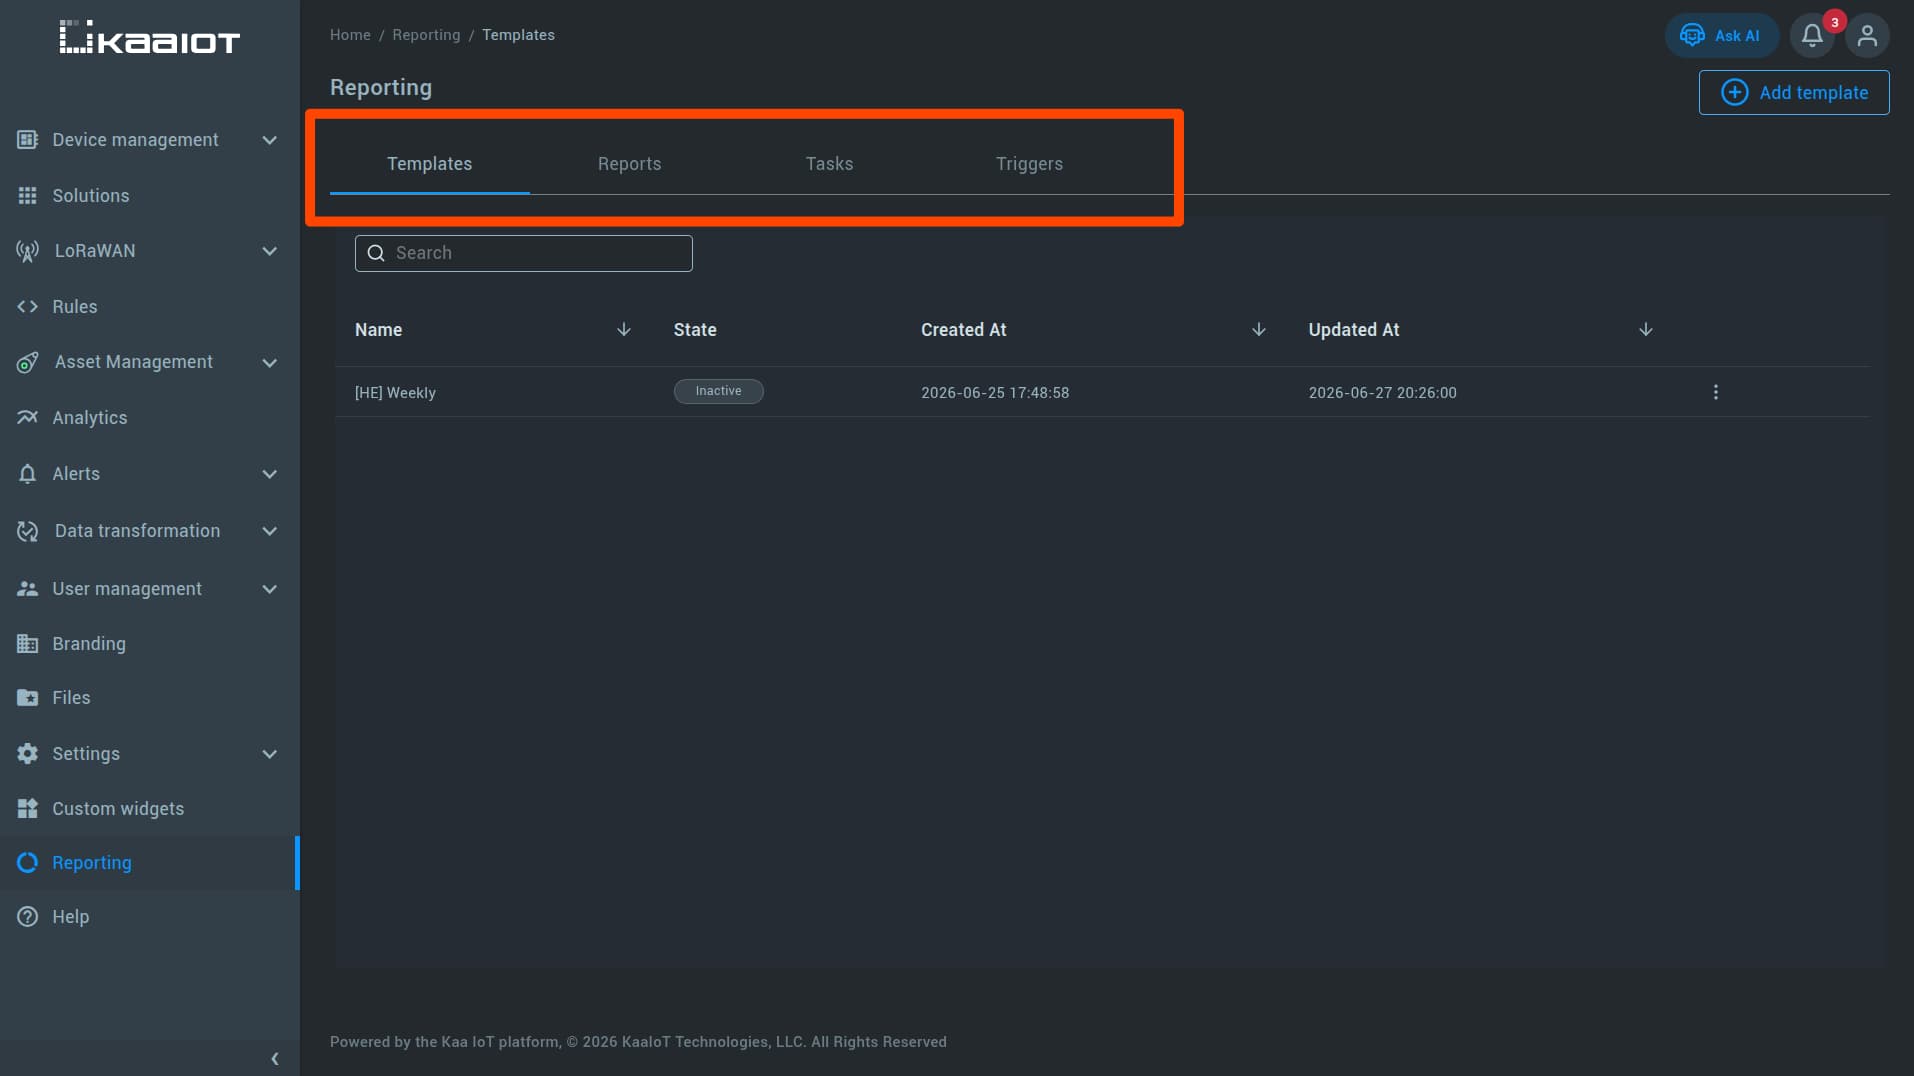
Reports UI Overview
When you open the Reports service, you will see 4 main tabs:
| Tab | Purpose |
|---|---|
Templates |
Create and manage report templates. You can create, enable, disable, edit, or delete templates here. |
Reports |
View and download reports that were already generated. |
Tasks |
Track report generation and delivery status and confirm that a report was created and sent successfully. |
Triggers |
Create scheduled triggers for report templates using a cron expression. |
Create Your First Report
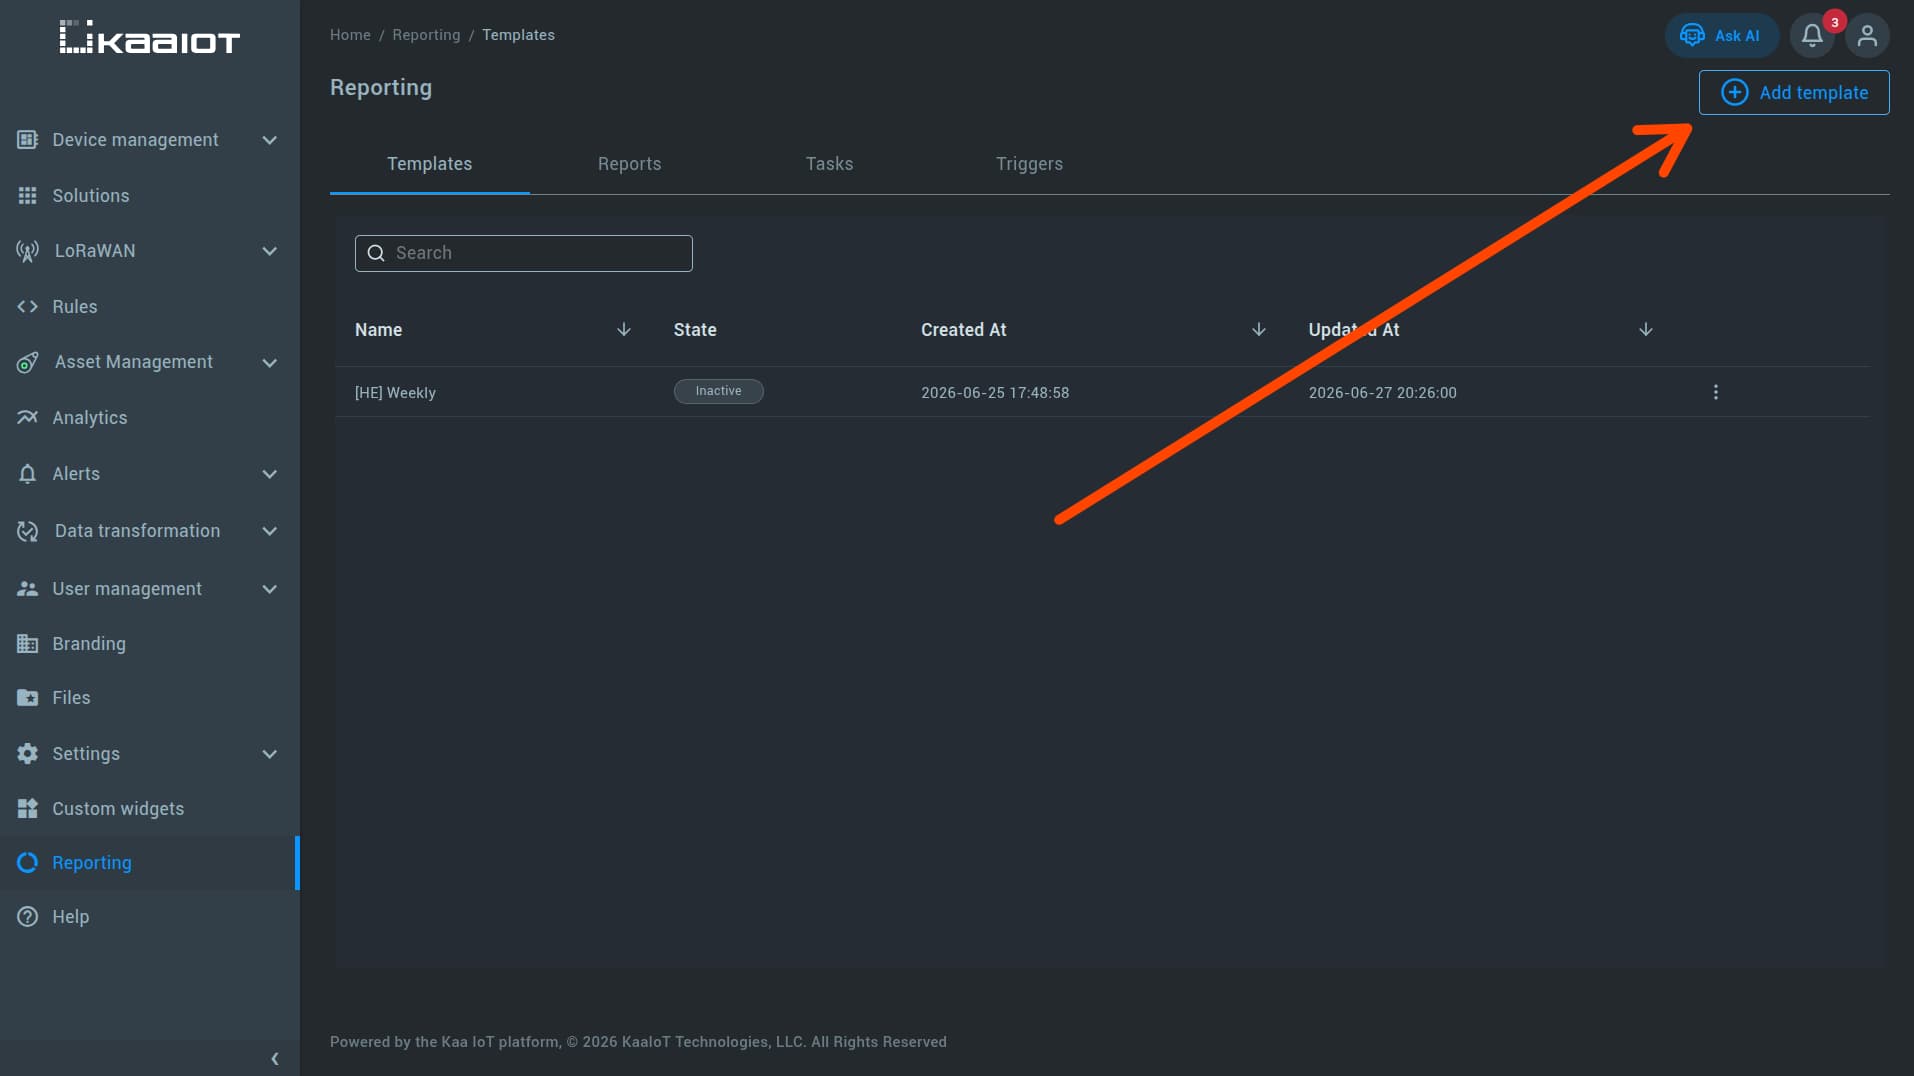
In the Reports service, click Add template in the top-right corner. The template editor is divided into 3 main sections. Let’s go over them 1 by 1.
Select data
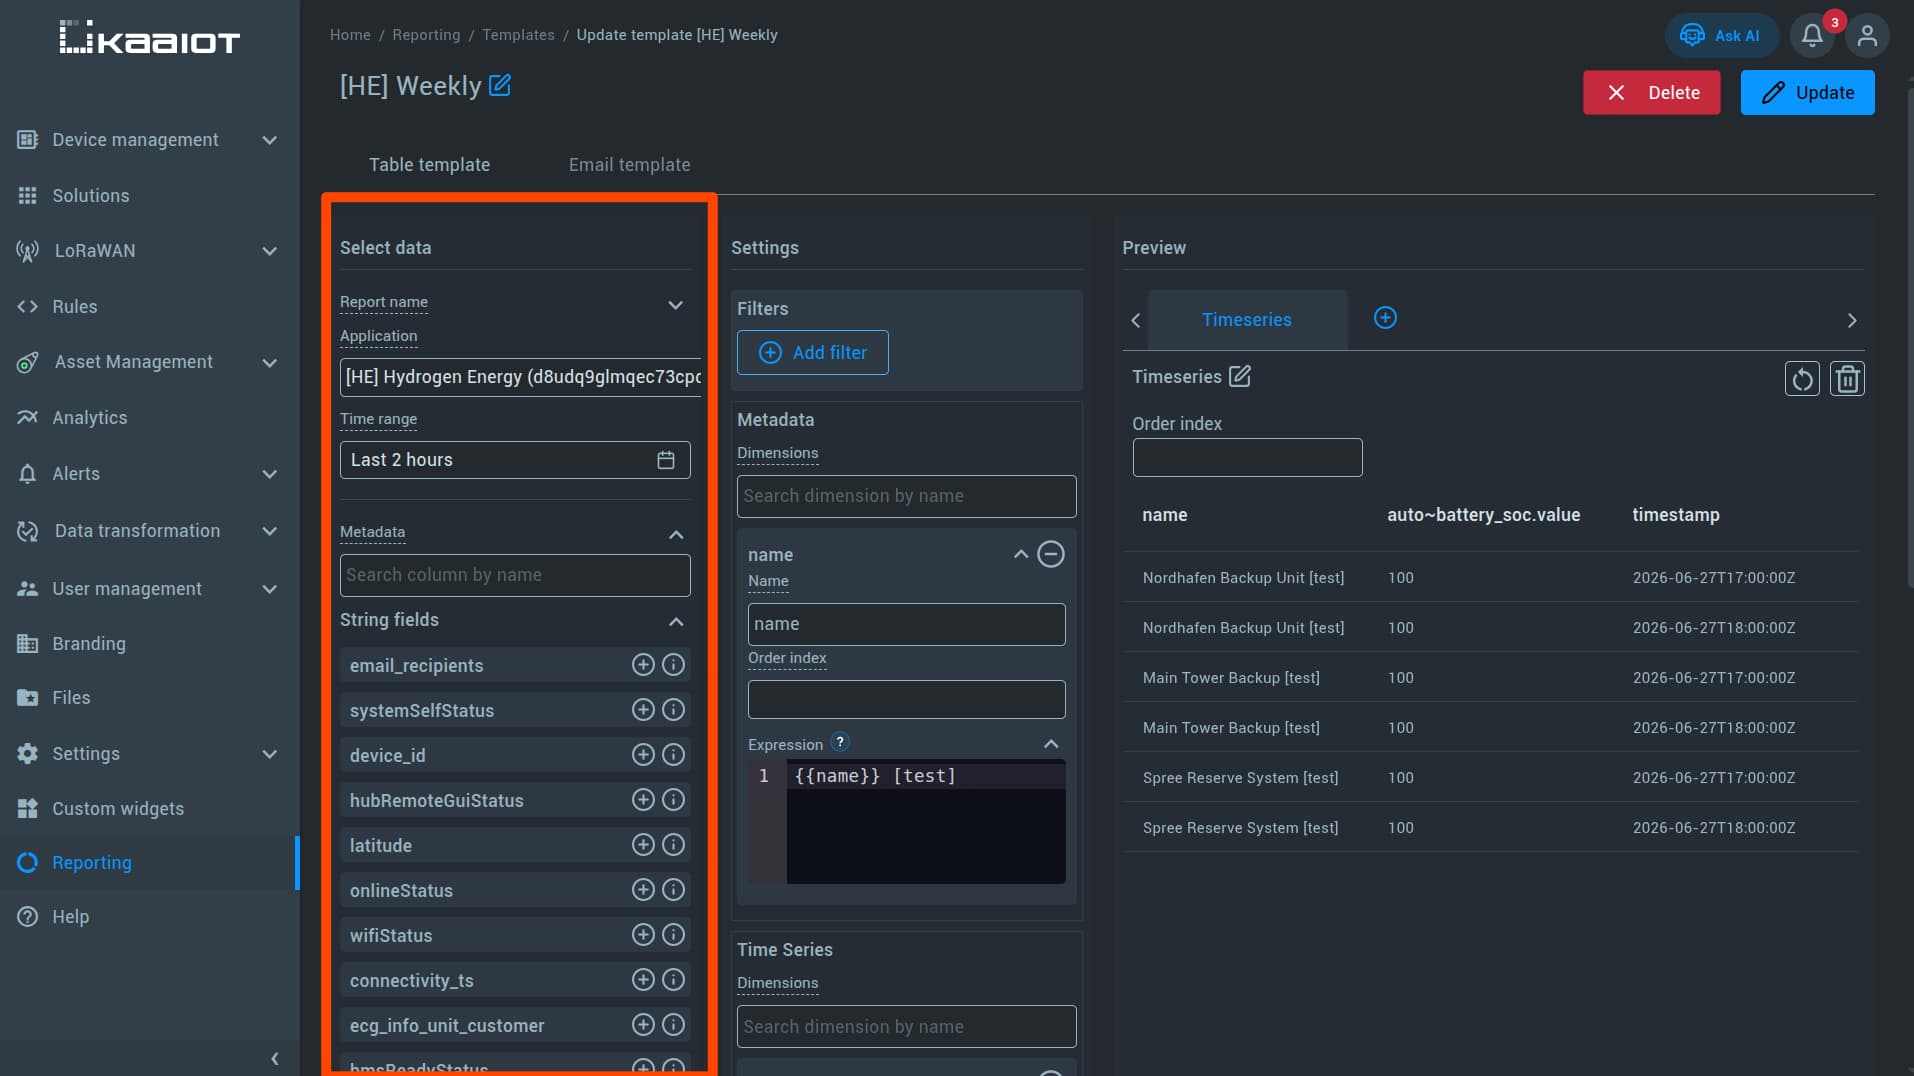
Start by selecting an application.
After that, choose the time range for the report and add one or more data sources.
The selected data sources will appear in the Settings row, where you can customize them further.
Available data sources include:
| Data source | What it shows |
|---|---|
Metadata |
Endpoint metadata shown as report columns. |
Analytics |
Aggregated time-series data such as sum, avg, min, and max for the selected time range. |
Time series |
Raw time-series values, including each recorded change within the selected time range. |
Assets |
Assets related to the selected application. |
Alerts |
Alerts that occurred during the selected time range. |
Note: Some data sources do not merge well into a single table. For example,
AssetswithAlerts. This is explained later in the guide.
Settings
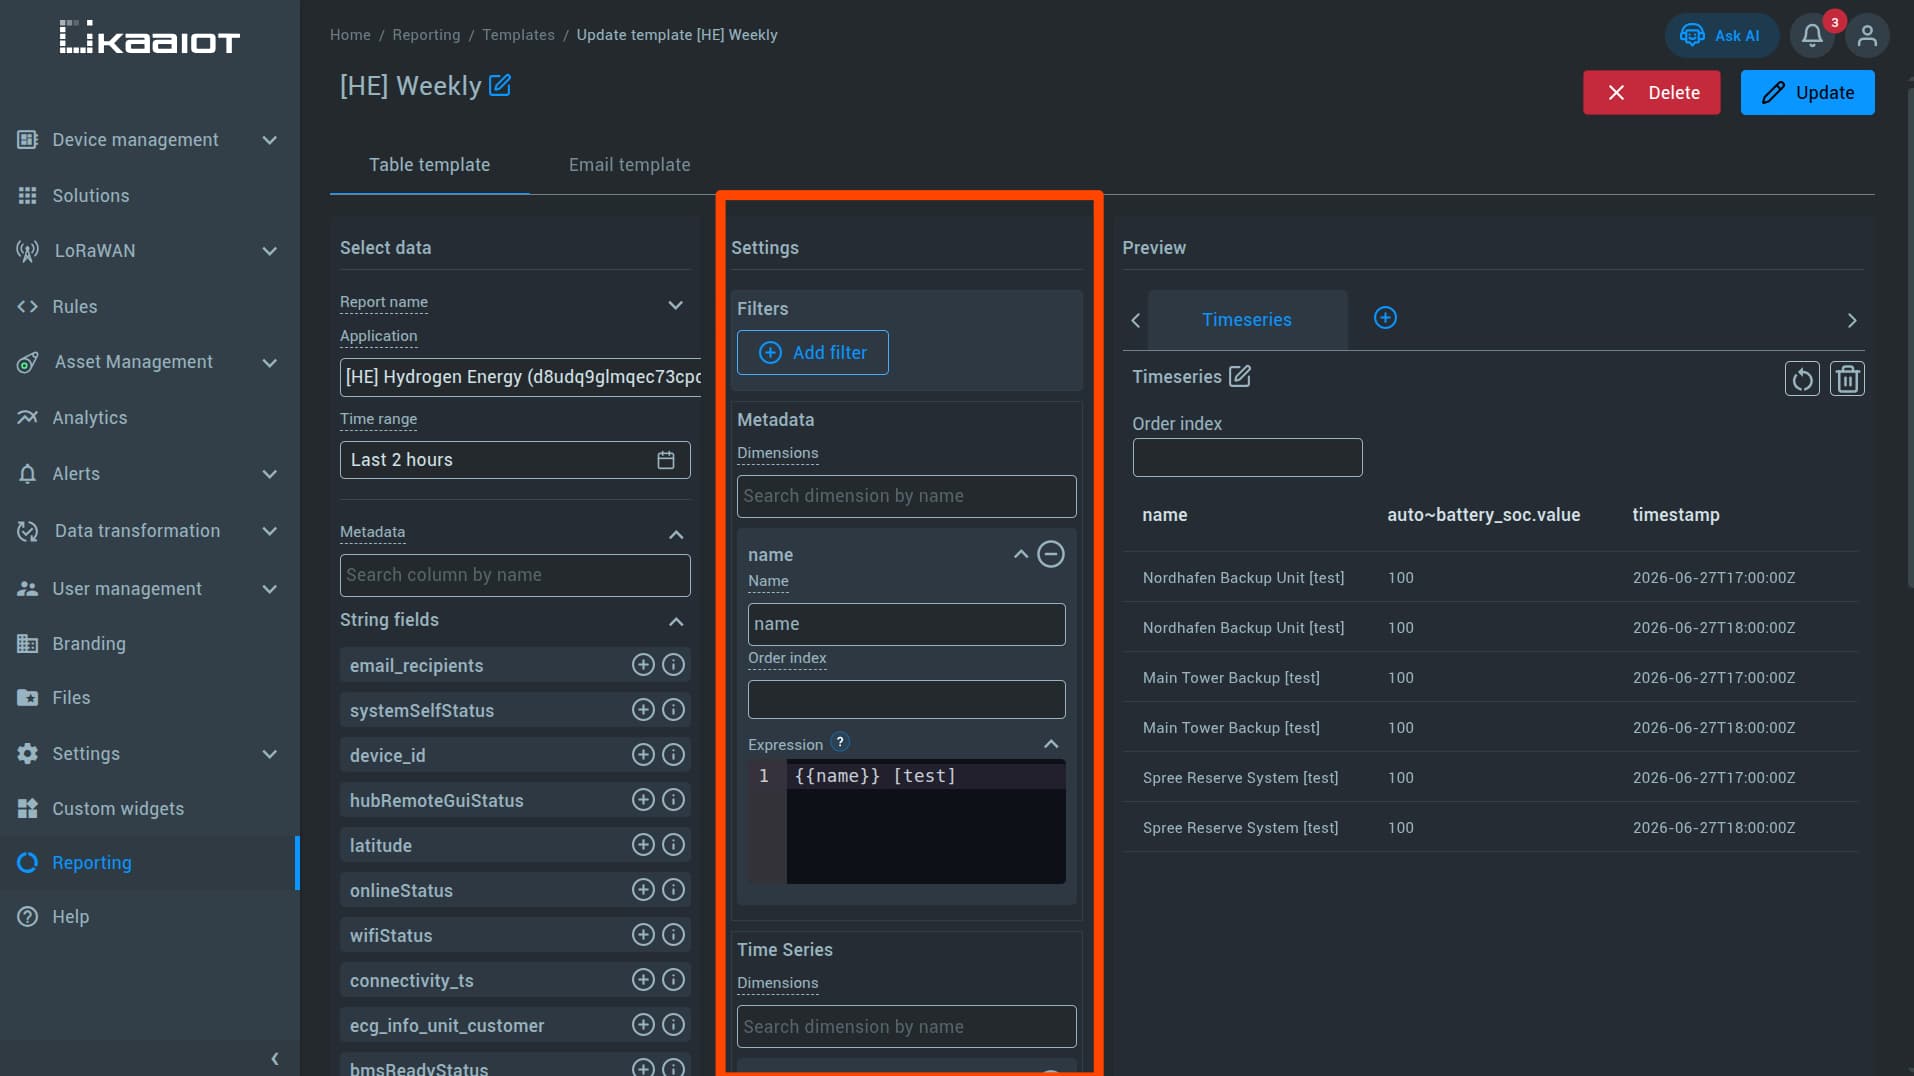
Each selected field can be configured in the Settings section.
| Option | Purpose |
|---|---|
| Name | Change the column name shown in the report. |
| Expressions | Edit how the value is displayed in the output. |
| Filters | Limit which records appear in the report. |
Expressions
Expressions let you customize column output. They are meant for simple formatting, not advanced logic. You cannot use regex or math here.
The following expressions are supported for formatting column values (replace column with the actual column name):
{{column}} km/h- Appends text to the value{{#dateTime}}{{column}}{{/dateTime}}- Formats a date as24 Jun 2026 23:59{{#dateOnly}}{{column}}{{/dateOnly}}- Formats a date as24 Jun 2026{{#timeOnly}}{{column}}{{/timeOnly}}- Formats a date as23:59:46{{#round}}{{column}}{{/round}}- Rounds to a whole number{{#round1}}{{column}}{{/round1}}- Rounds to 1 decimal place{{#round2}}{{column}}{{/round2}}- Rounds to 2 decimal places
Filters
Use filters to limit which records appear in the report.
For example, you can use filters to show only specific endpoints, values from a certain period, or selected alert records.
Preview
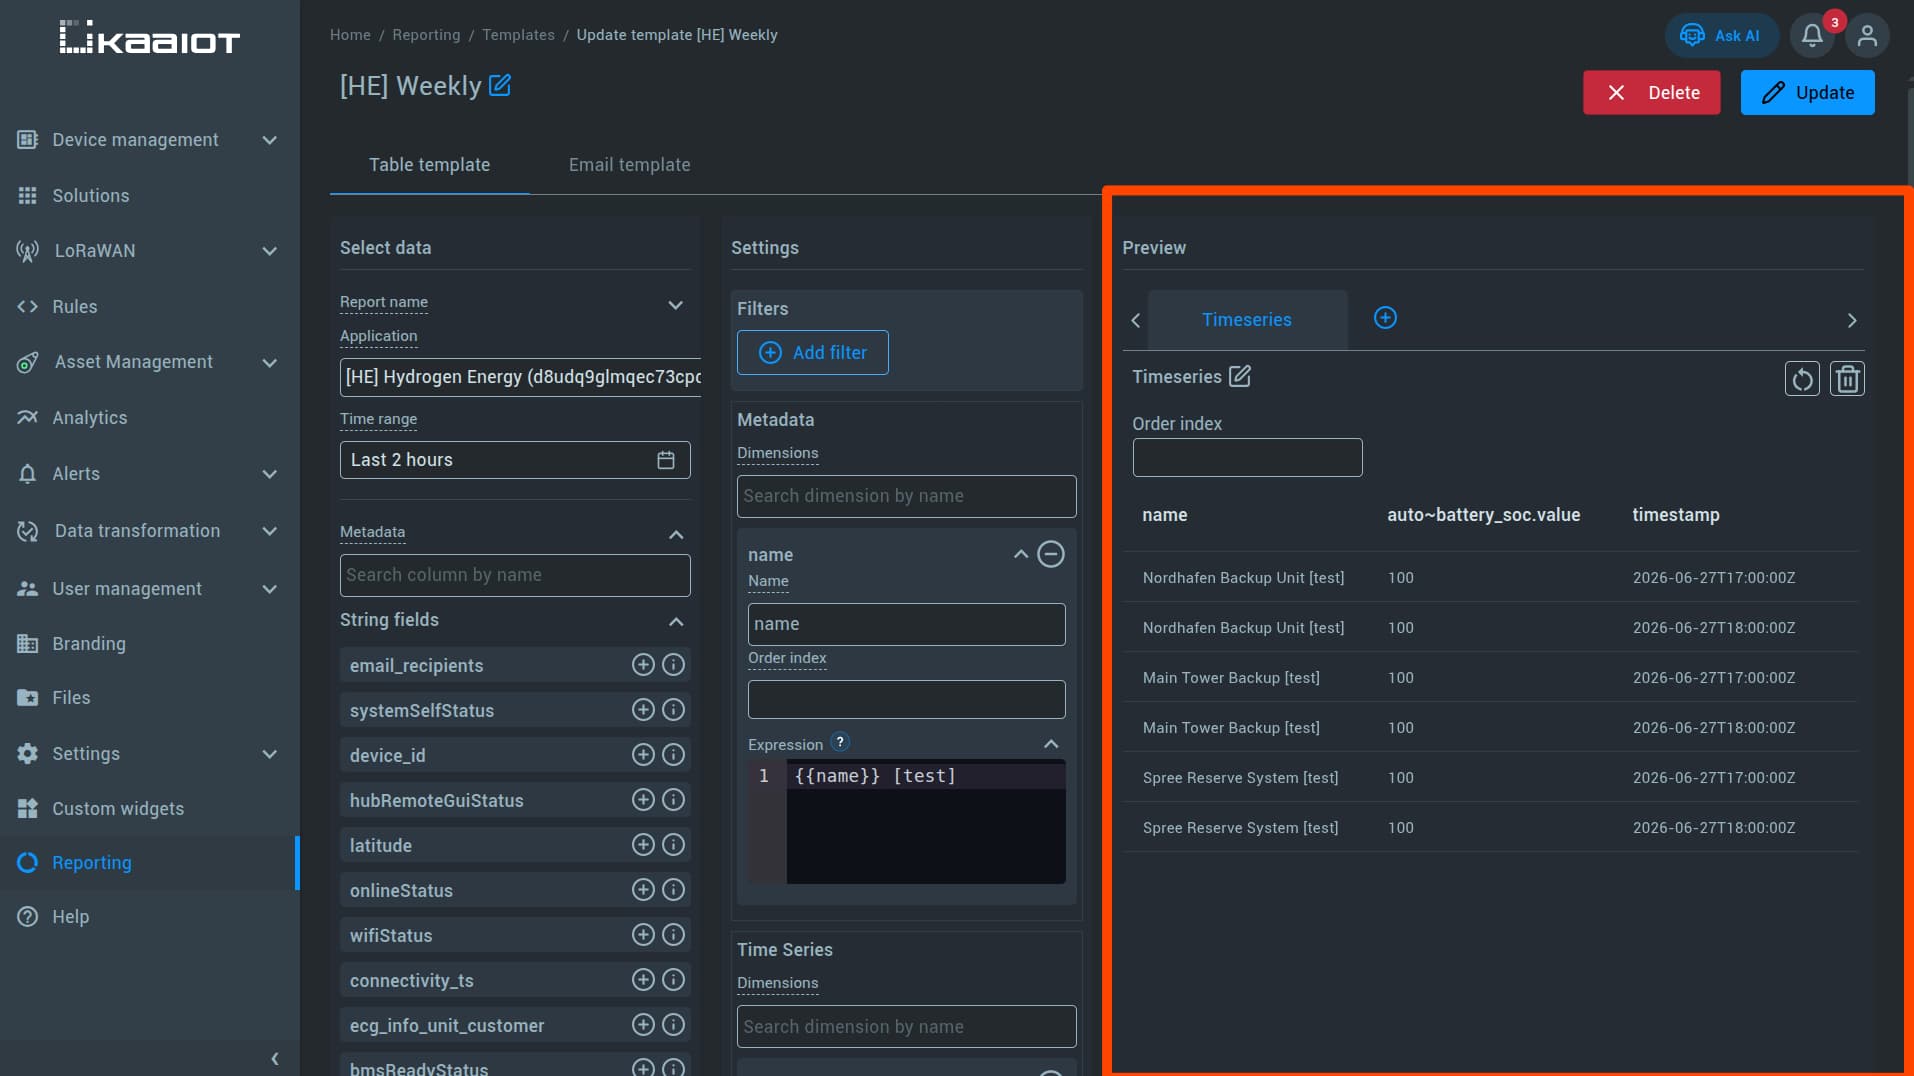
The Preview section shows the final output of your report before you save the template.
Data merge rules
Not every data type can be merged into the same table:
| Data type | Merge behavior |
|---|---|
Metadata |
Can be merged with analytics or time series. |
Analytics + Time series |
Cannot be merged into the same table. |
Assets |
Cannot be merged with other data types. |
Alerts |
Cannot be merged with other data types. |
Alerts still include information about the endpoint on which the alert was triggered, but they should remain in a separate table.
If you combine incompatible data sources in a single table, the report may fail to generate or may be rendered as multiple data blocks displayed sequentially. In most cases, the cleaner approach is to create a separate table for each incompatible data source.
Email Template and Export
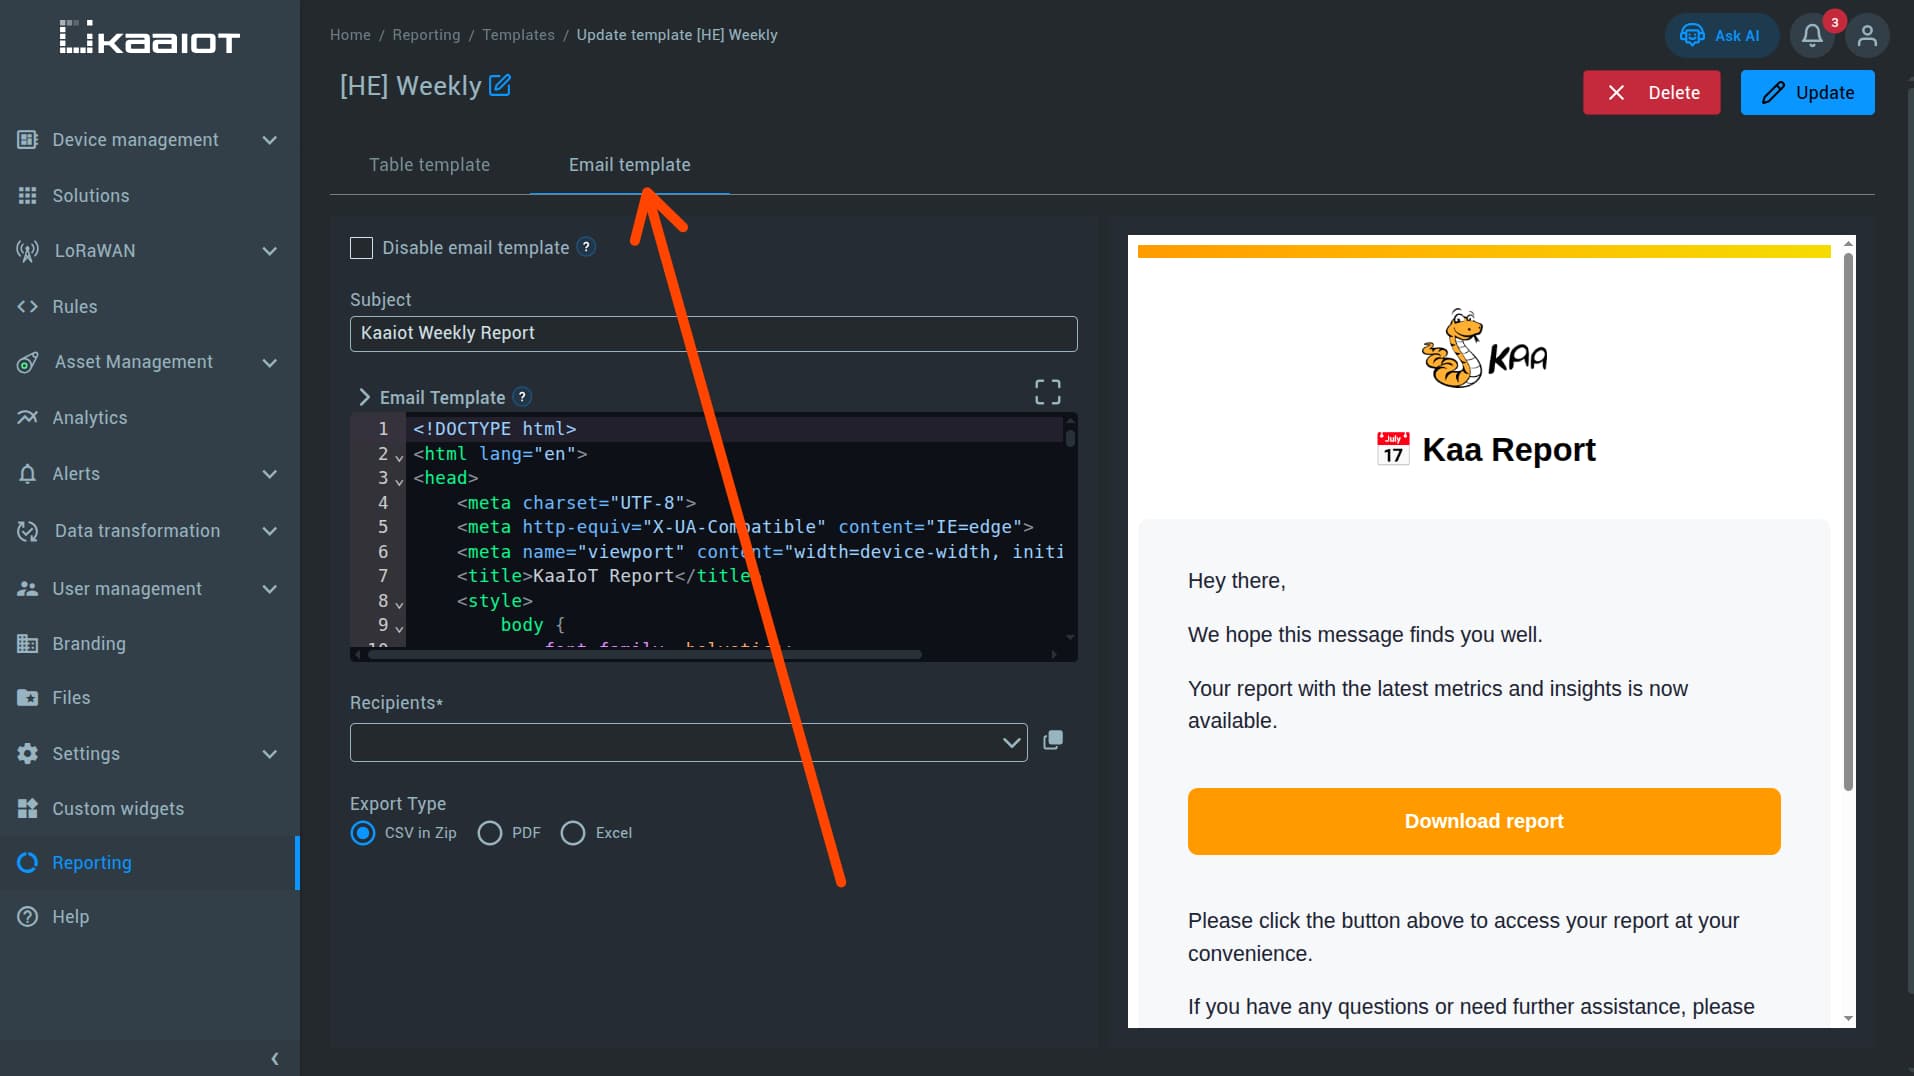
Each report template can also define delivery settings.
| Setting | Purpose |
|---|---|
Email template |
Define the email body as an HTML document. |
Recipients |
Specify the email addresses that should receive the report. |
Export type |
Choose the report format: CSV, PDF, or Excel. |
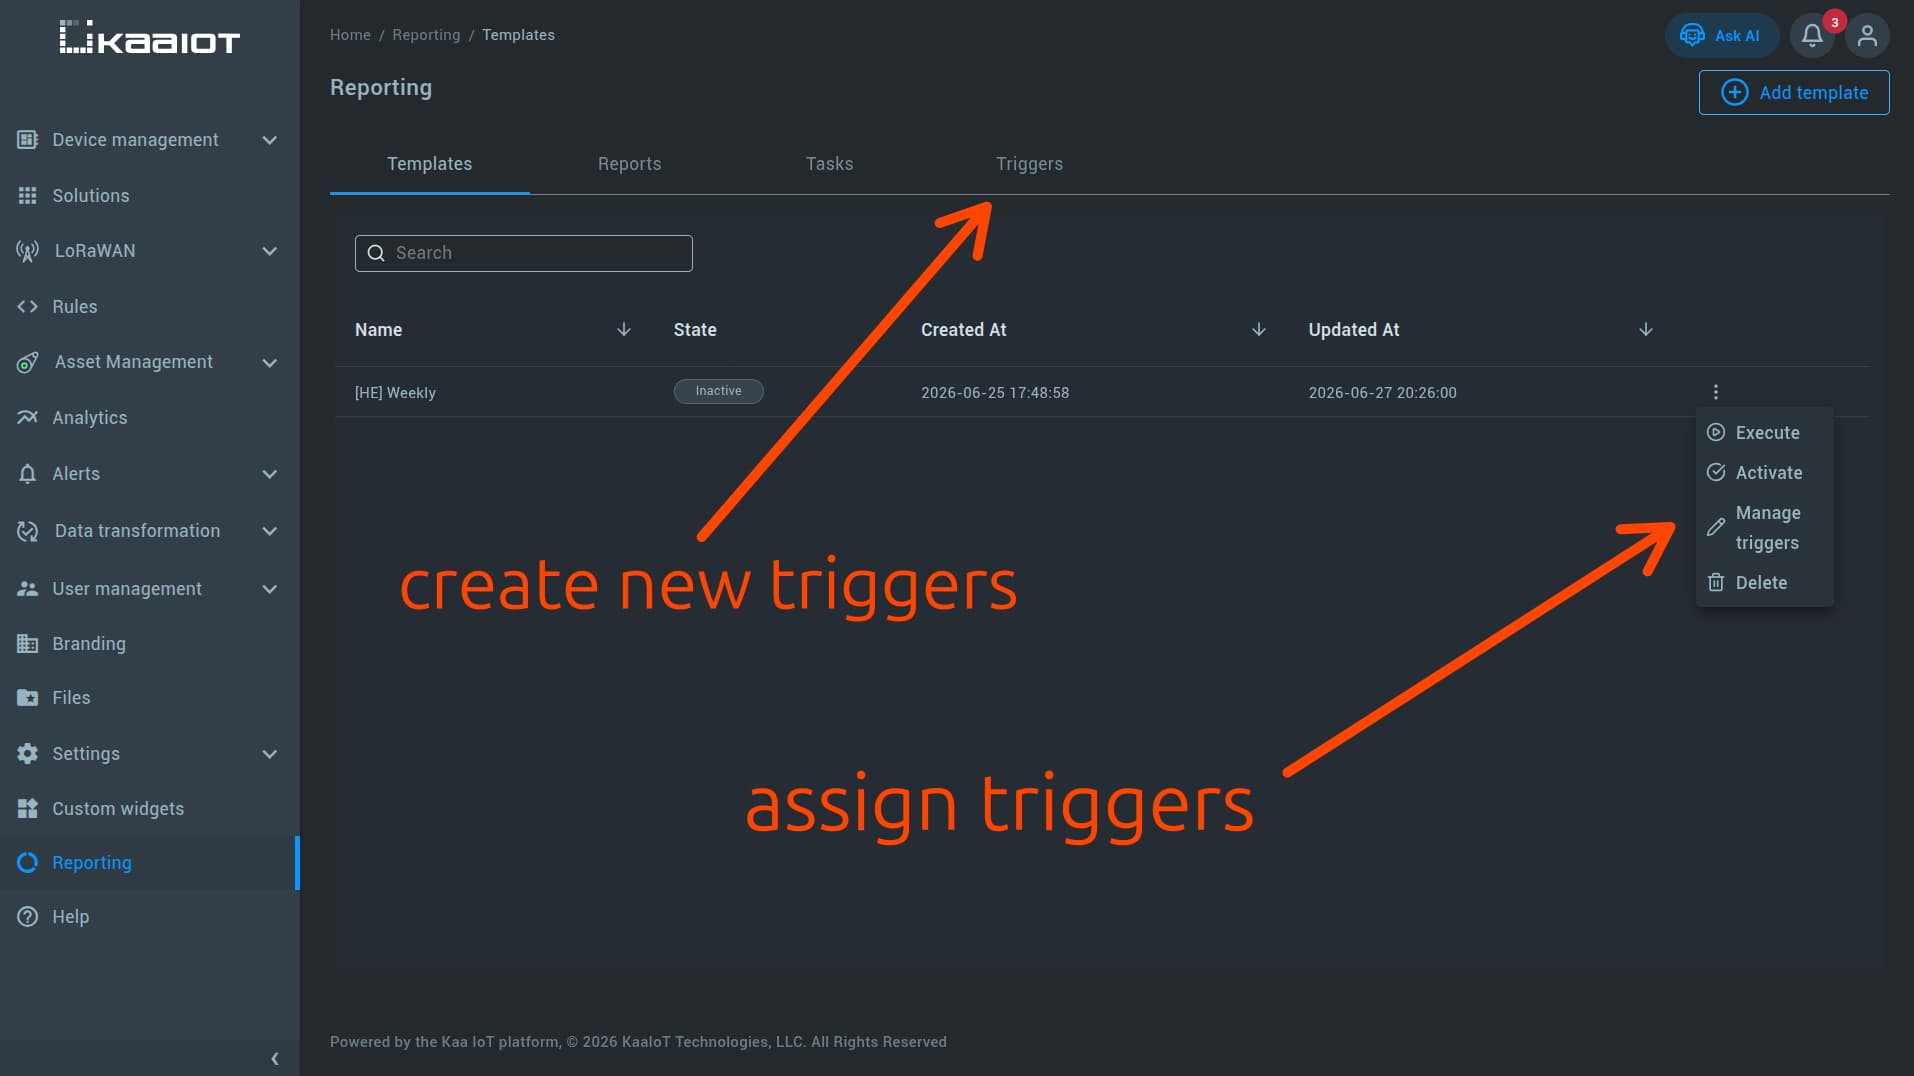
Triggers
A trigger is a scheduled job based on a cron expression. It sends a report automatically to the configured recipients.
Each trigger must be assigned to a report template. After creating a template, you’ll be prompted to create a trigger, or you can create and assign one manually later.
Trigger examples:
- send a report every hour:
0 0 * * * ? - send a report every Monday:
0 0 0 ? * MON - send a monthly summary:
0 0 0 1 * ?
For cron syntax details, refer to the Quartz CronTrigger documentation.