Data Transformation
- Overview
- Prerequisites
- Initial Setup
- Example #1: Transforming Celsius to Fahrenheit
- Example #2: Calculating Battery Power
- Example #3: Flatten Incoming Data Sample
- Troubleshooting
Overview
This guide explains how to use the Kaa Rule Engine to transform and manipulate received data. It provides step-by-step examples to help you get started. By the end of this guide, you will be able to write your own data transformation rule.
Prerequisites
- A valid Kaa Cloud account.
- We assume that you have successfully connected your first device to Kaa, so make sure to review the Getting Started guide before proceeding here.
- Basic knowledge of the Rule Engine and its architecture.
- Time series Auto-extraction feature is enabled.
Initial Setup
Before proceeding with the practical examples below, some setup is required.
This section explains how to:
- Set up an application.
- Create an endpoint.
- Simulate device telemetry by publishing mock data through the “Data Publish” tab on the “Device” page.
Create an Application and Endpoint
- Log in to your Kaa account.
- Create a new application and endpoint.
If you’re unfamiliar with this process, refer to the Getting Started Guide.
Publish Device Data
After creating the endpoint, follow these steps to publish data sample to Kaa simulating data from a device:
- Navigate to the “Device” page and open the “Data Publish” tab.
- In the “Data Publish” UI:
- Enable the HTTP communication type.
- Paste your endpoint token into the provided field on the right.
- Ensure that Send data samples option is selected.
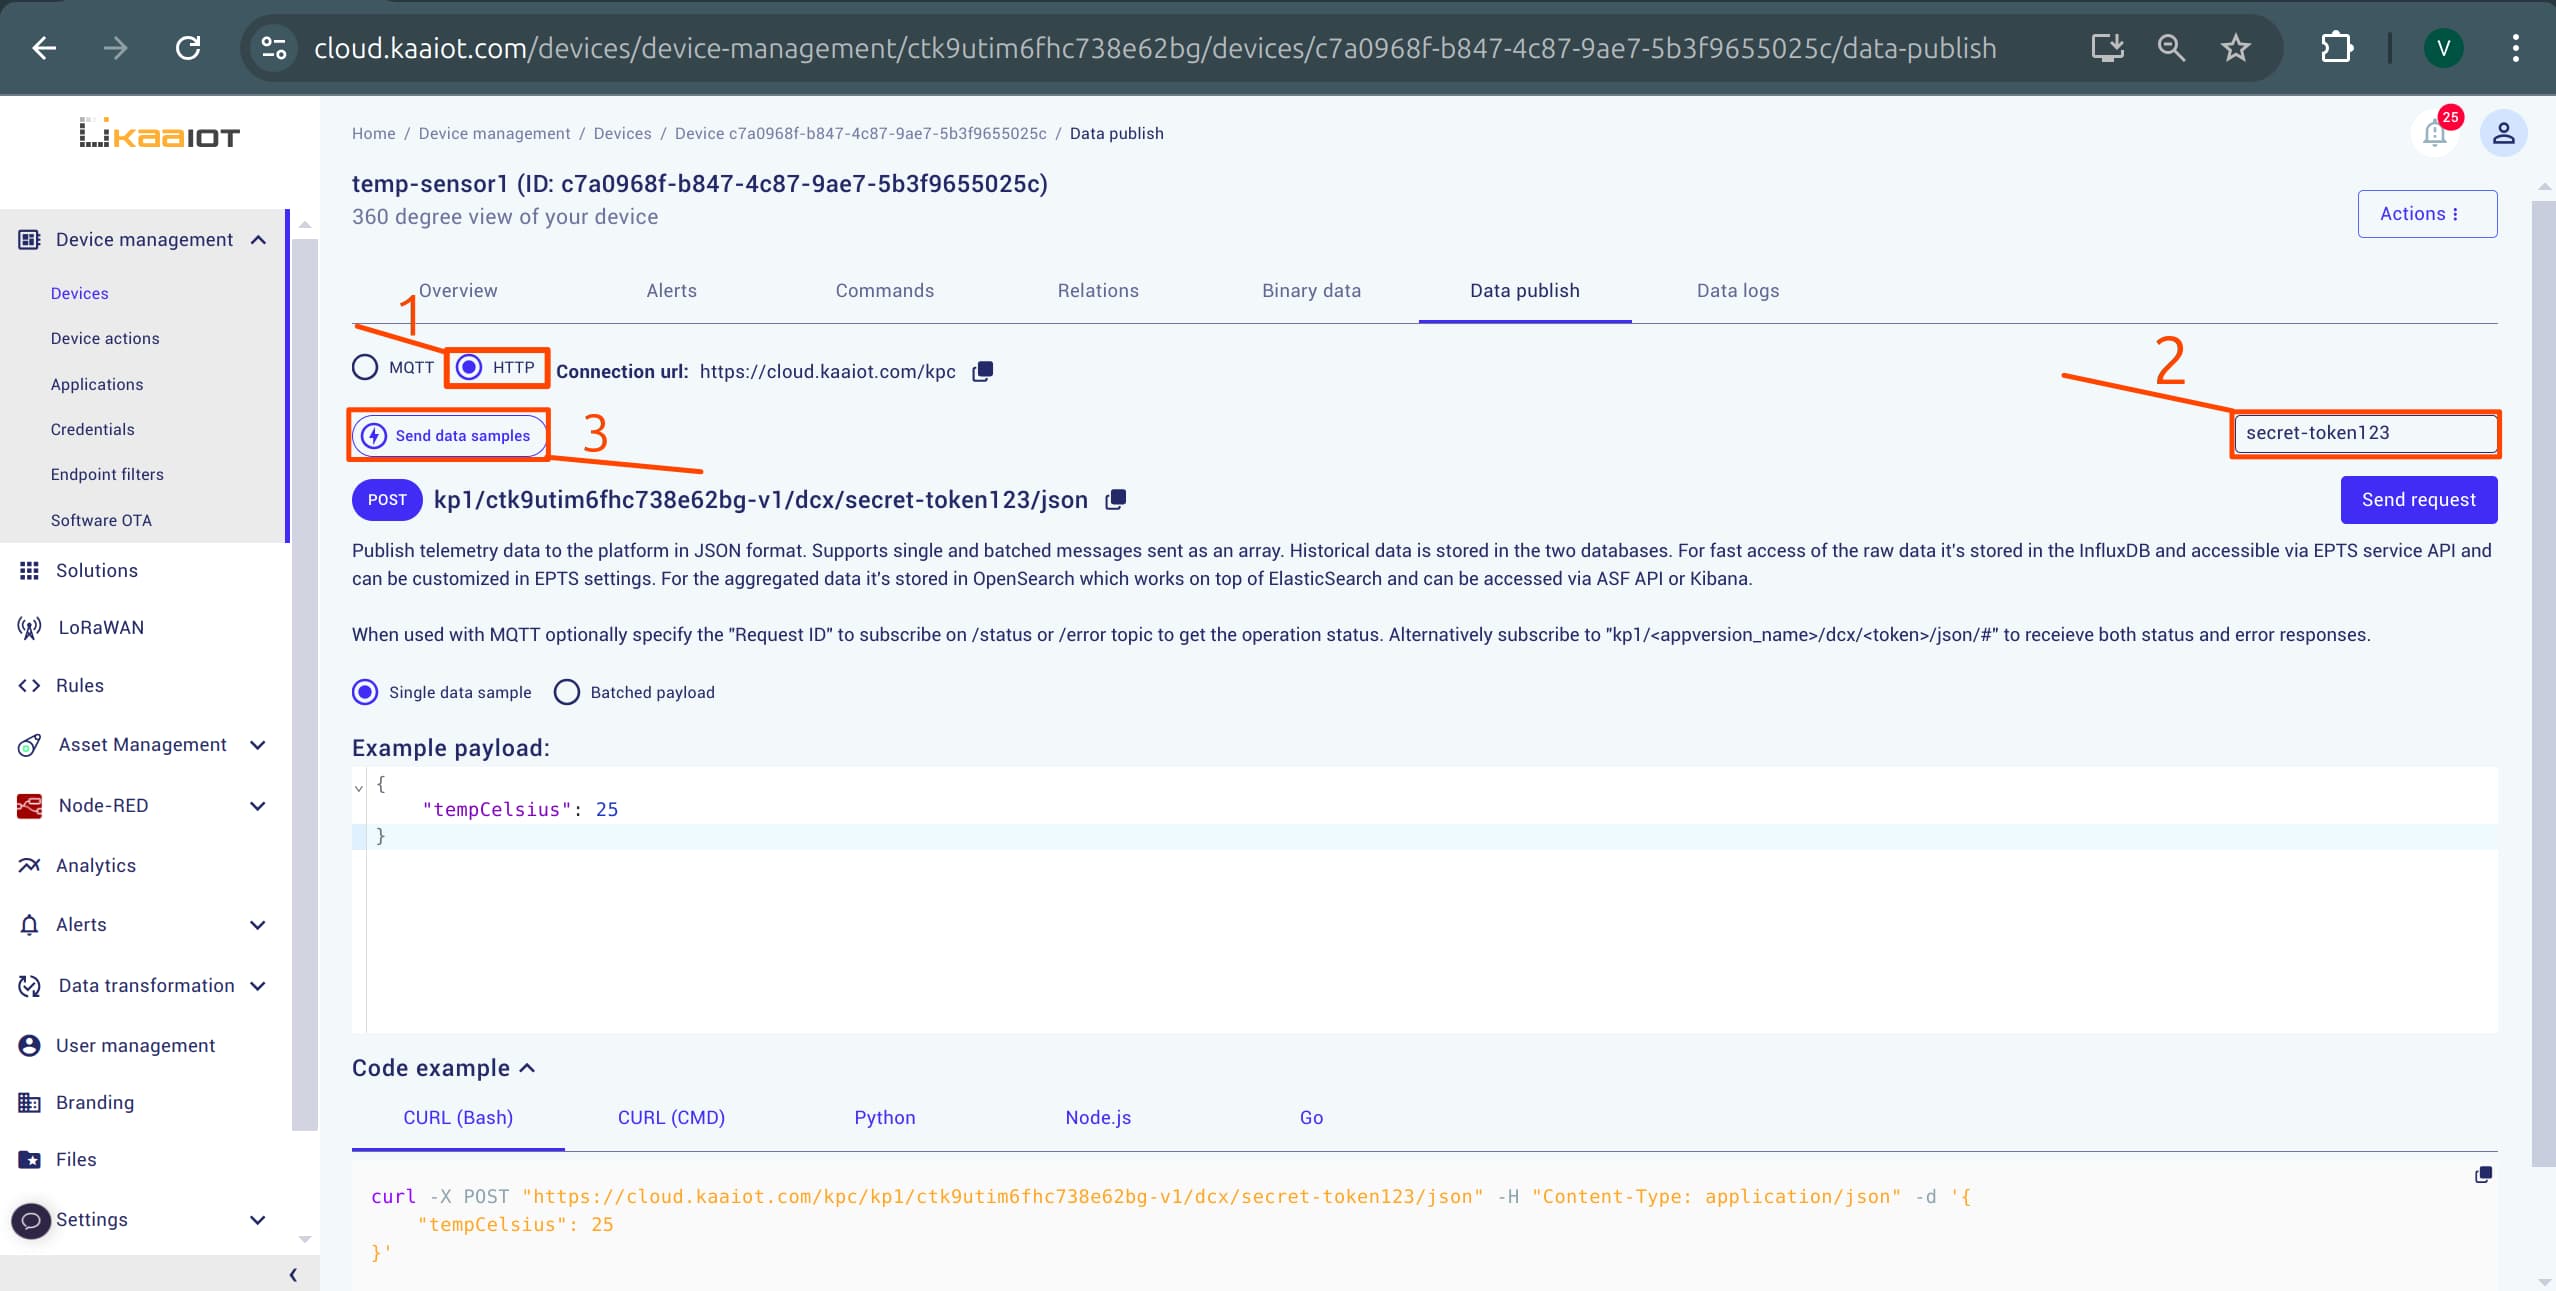
Paste a JSON payload into the Example Payload field. It will be our device data.
{
  "tempCelsius": 25
}
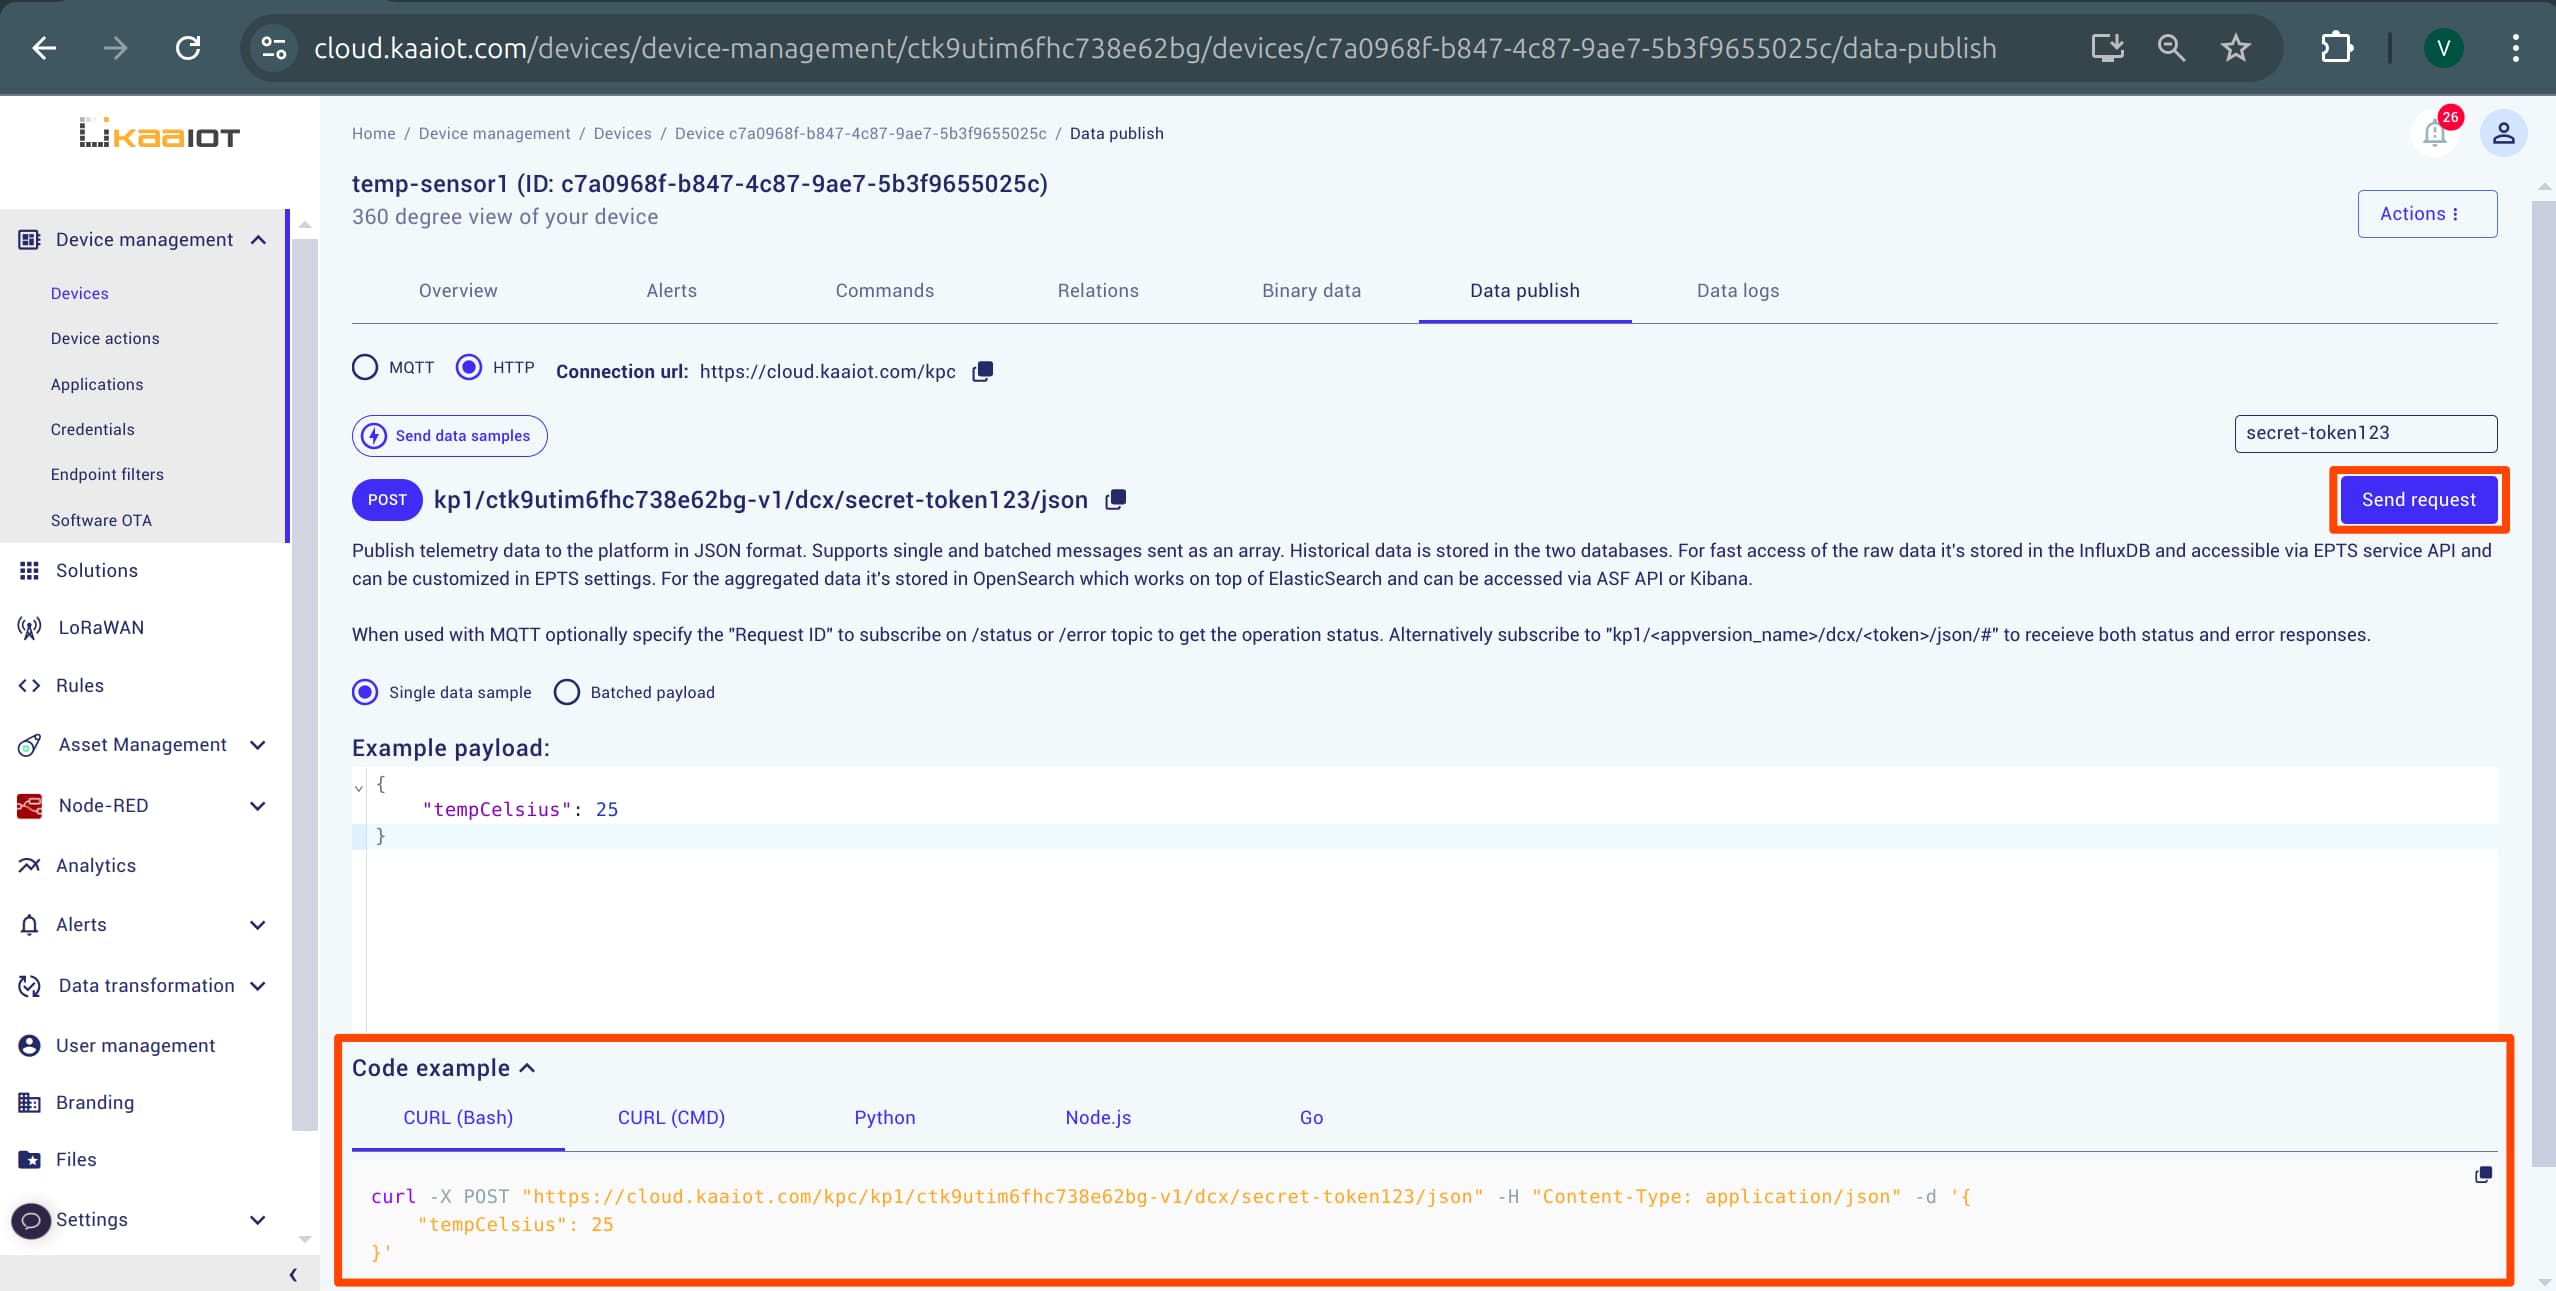
Click Send Request to send the JSON payload. Similarly, you can use a generated cURL command to send a sample of data from outside Kaa.
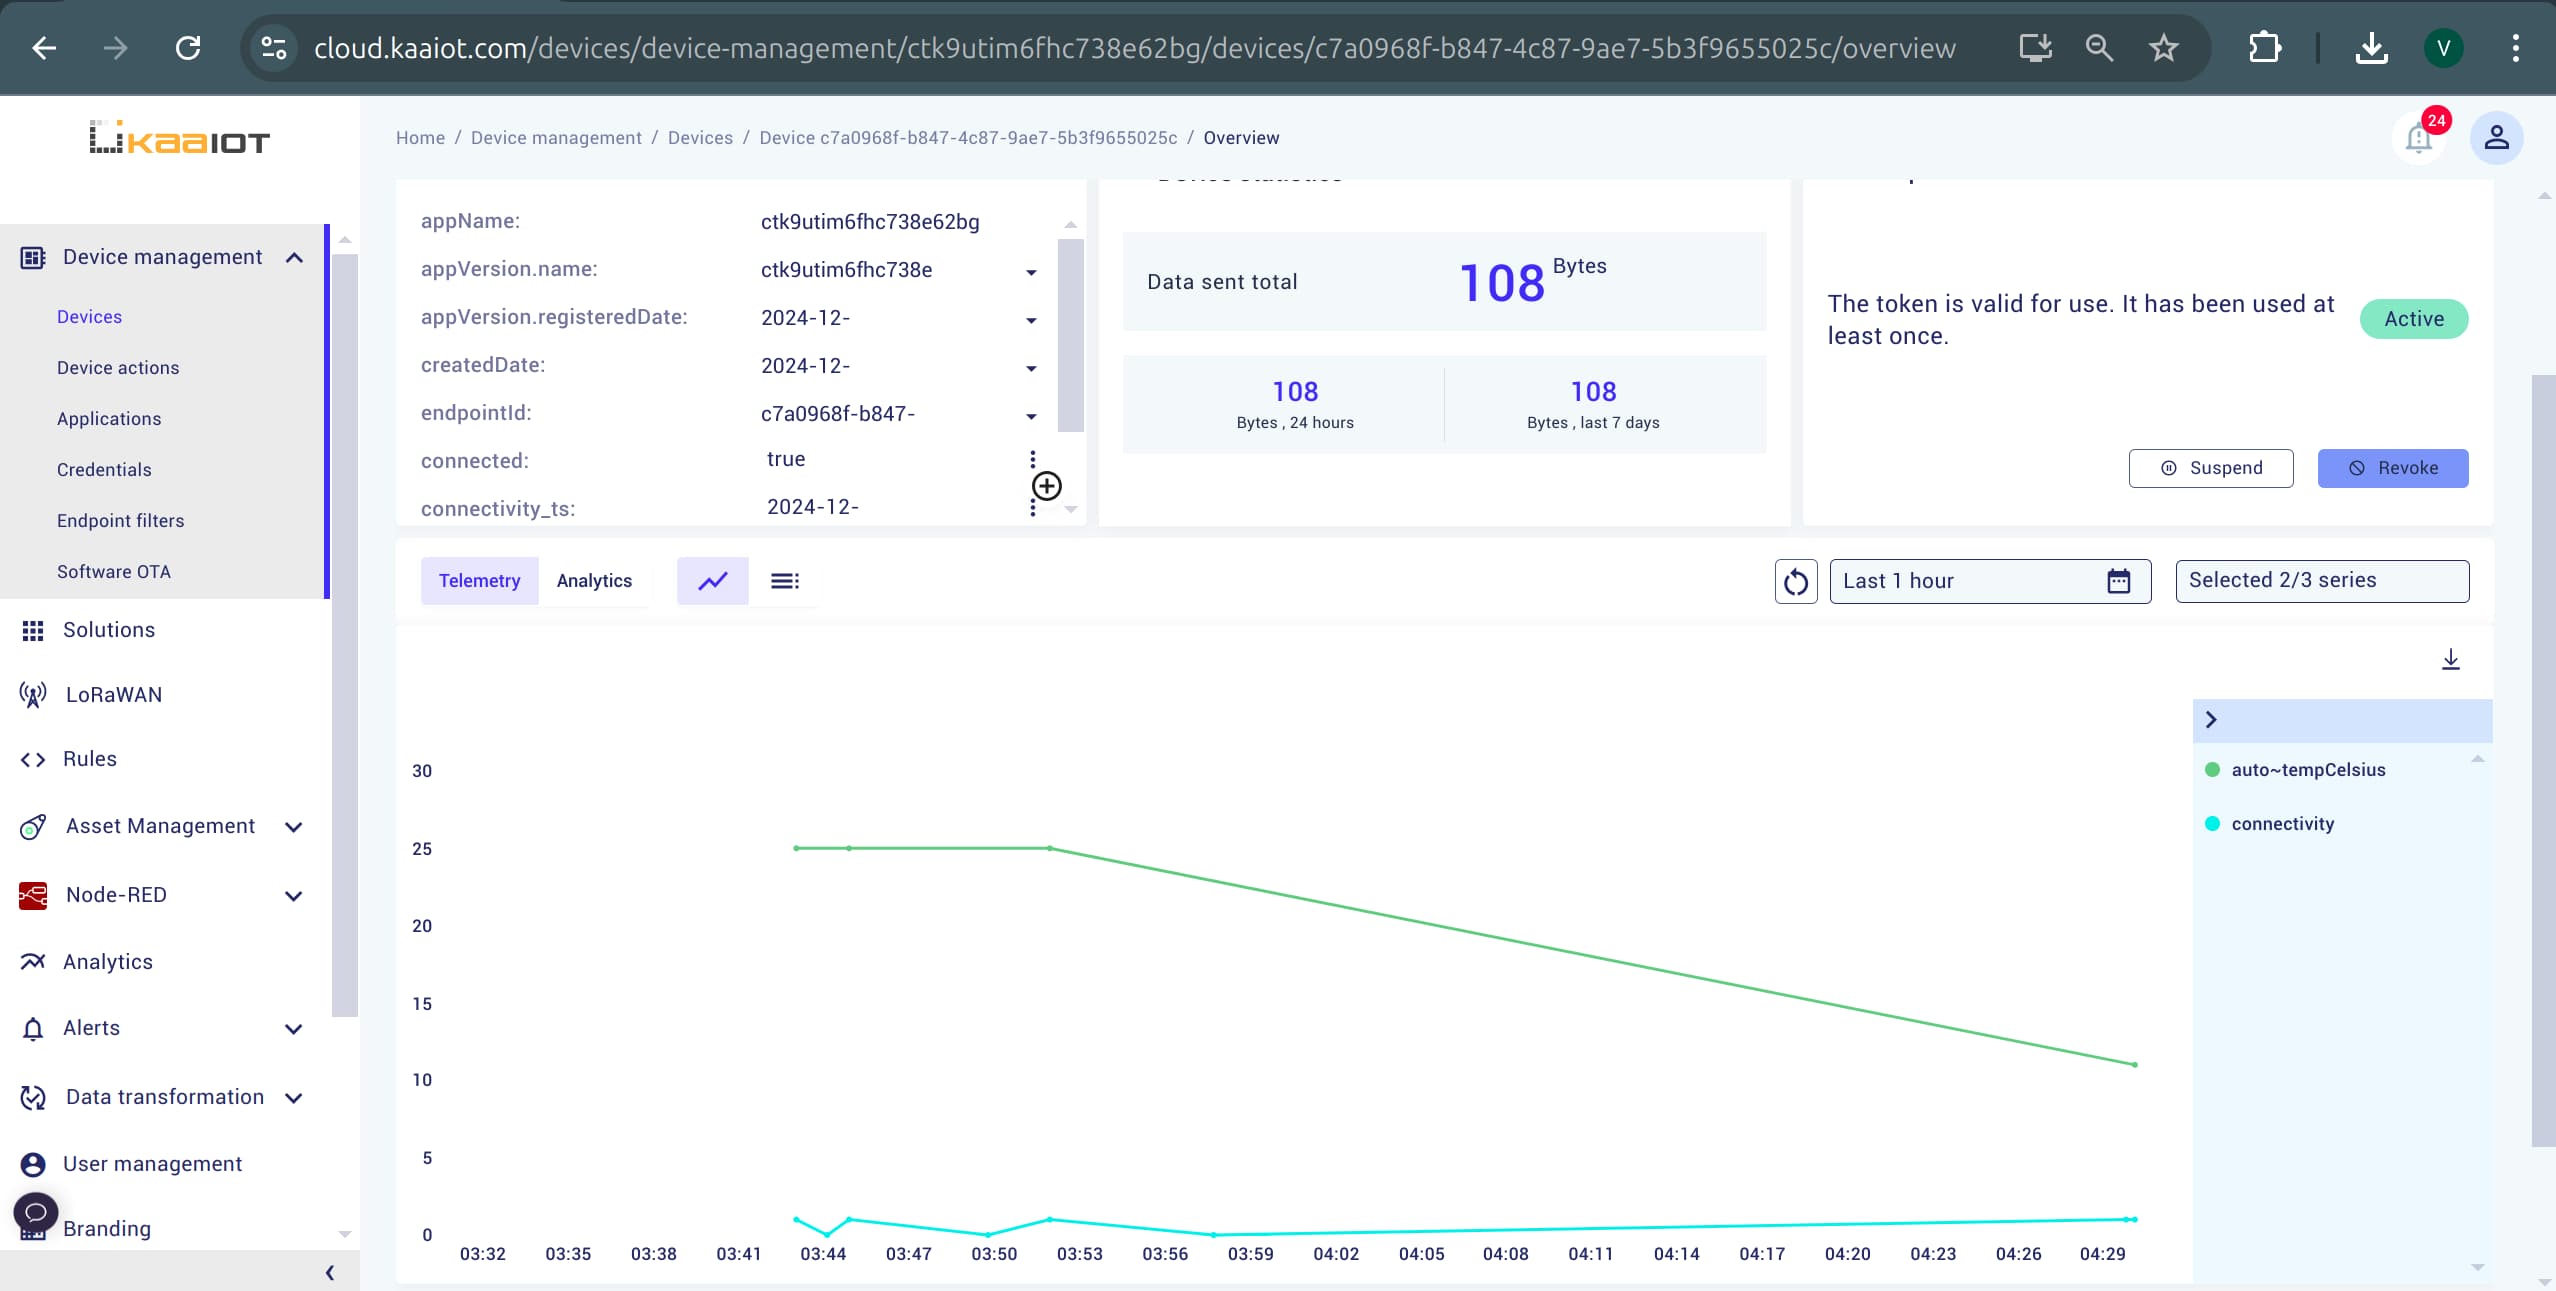
After sending the data sample, navigate back to the device “Overview” page to verify that the data was received.
The received data will be displayed on the “Telemetry” widget.
Example #1: Transforming Celsius to Fahrenheit
In this first example, we’ll create a rule that automatically converts the temperature from Celsius to Fahrenheit and outputs the result in a separate time-series auto~tempFahrenheit.
Example Setup
Complete the initial setup. This is the data we’ll send through “Data Publish” and then transform using the Rule Engine:
{
  "tempCelsius": 25
}
Create a New Rule
- In the sidebar, navigate to “Rules”.
- Click Add Rule and provide a
namefor the rule.
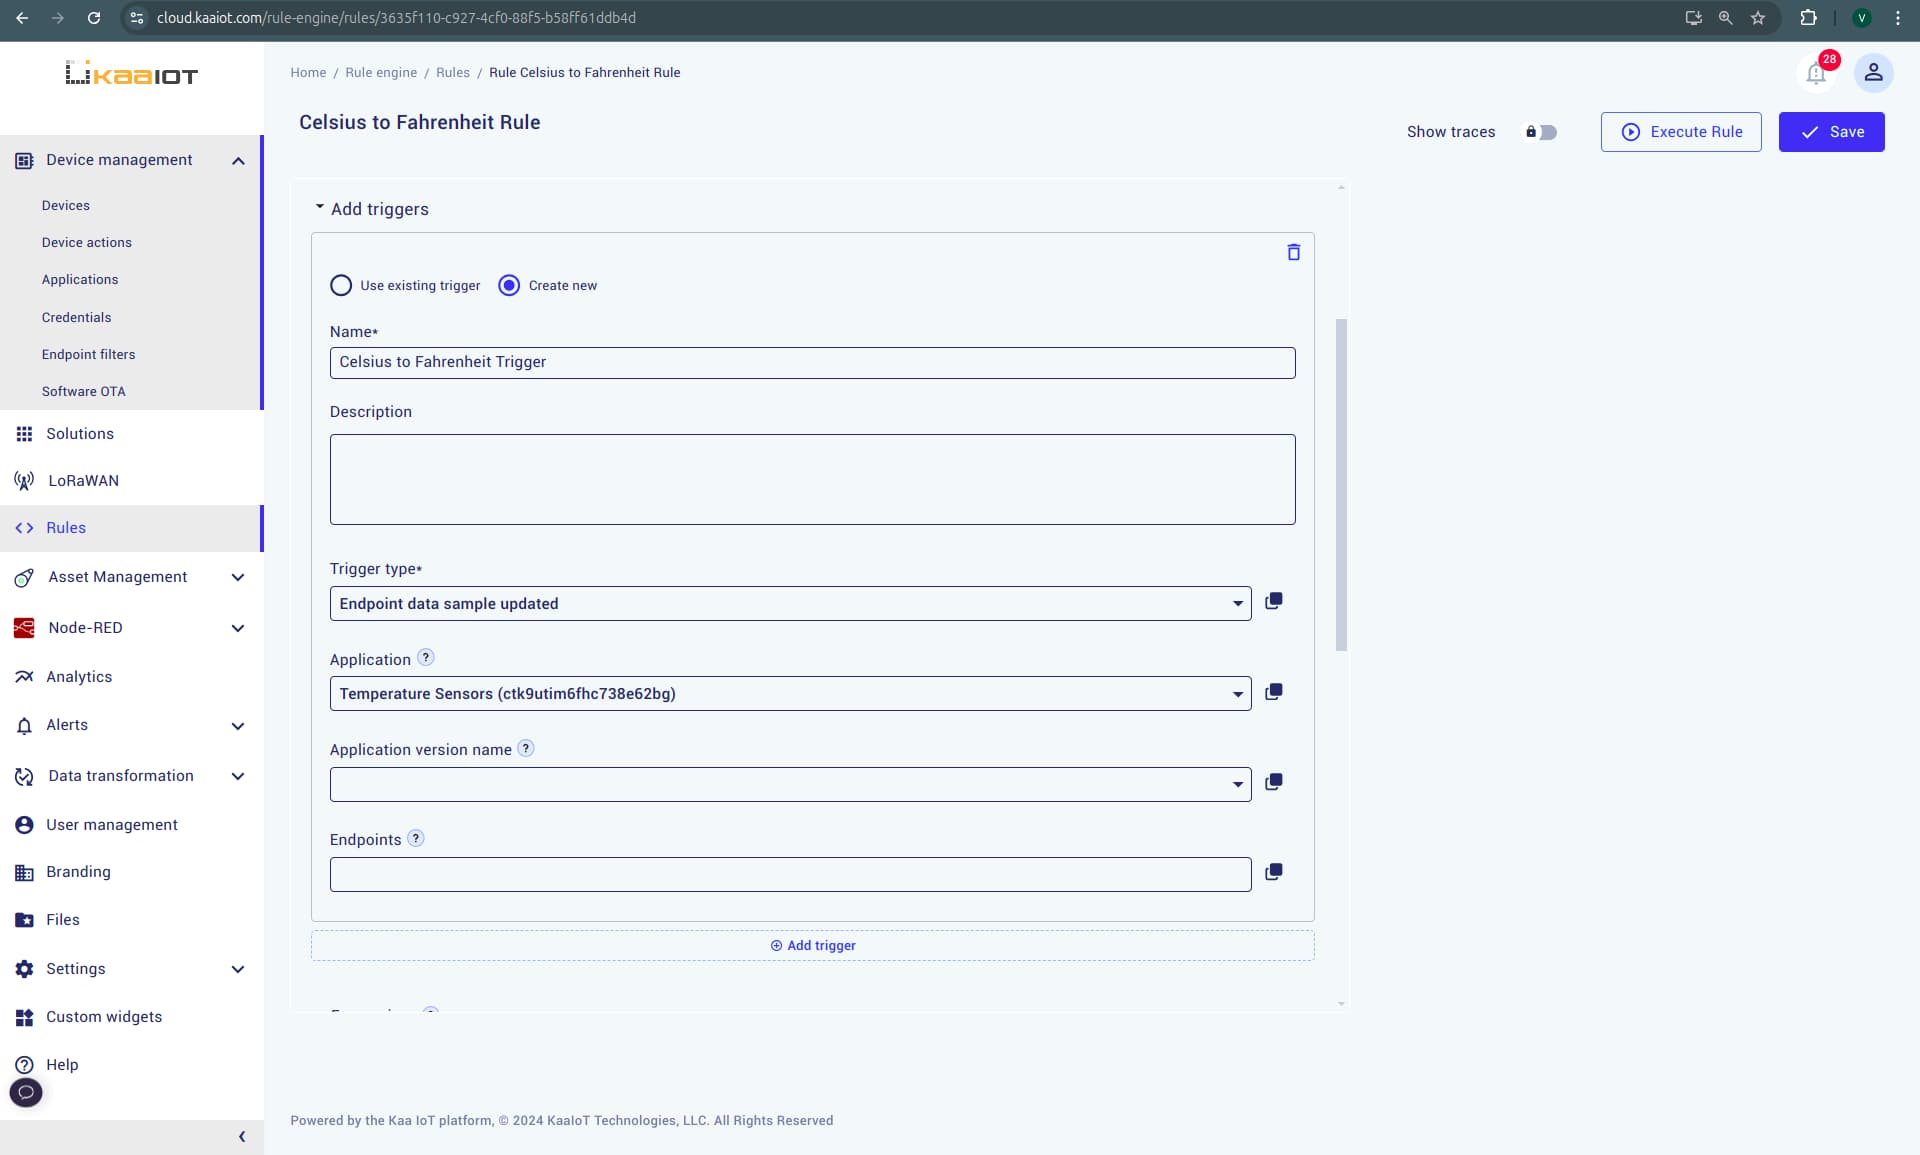
Add a Trigger
Note: If you’re unfamiliar with triggers, you can learn more here.
- Click Add Trigger.
- There are multiple trigger types available, each defining when the rule is triggered.
For this example, set the Trigger Type to
Endpoint data sample updated. - Fill in the required details:
- Trigger Name
- Application
- Application Version (leave empty to apply the trigger to all endpoints within the specified above application)
- Endpoint(s) (leave empty to apply the trigger to all endpoints within the specified above application version)
For more details about triggers and their types, refer to the Rule Engine Triggers documentation.
This trigger will execute the rule whenever we publish new data.
Set Condition
Scroll down to the Condition section and add the expression:
return true;
You can add conditions to the rule, but for now, simply skip them by using the above return statement in order to execute the below action unconditionally. More info on what rule can return can be found here.
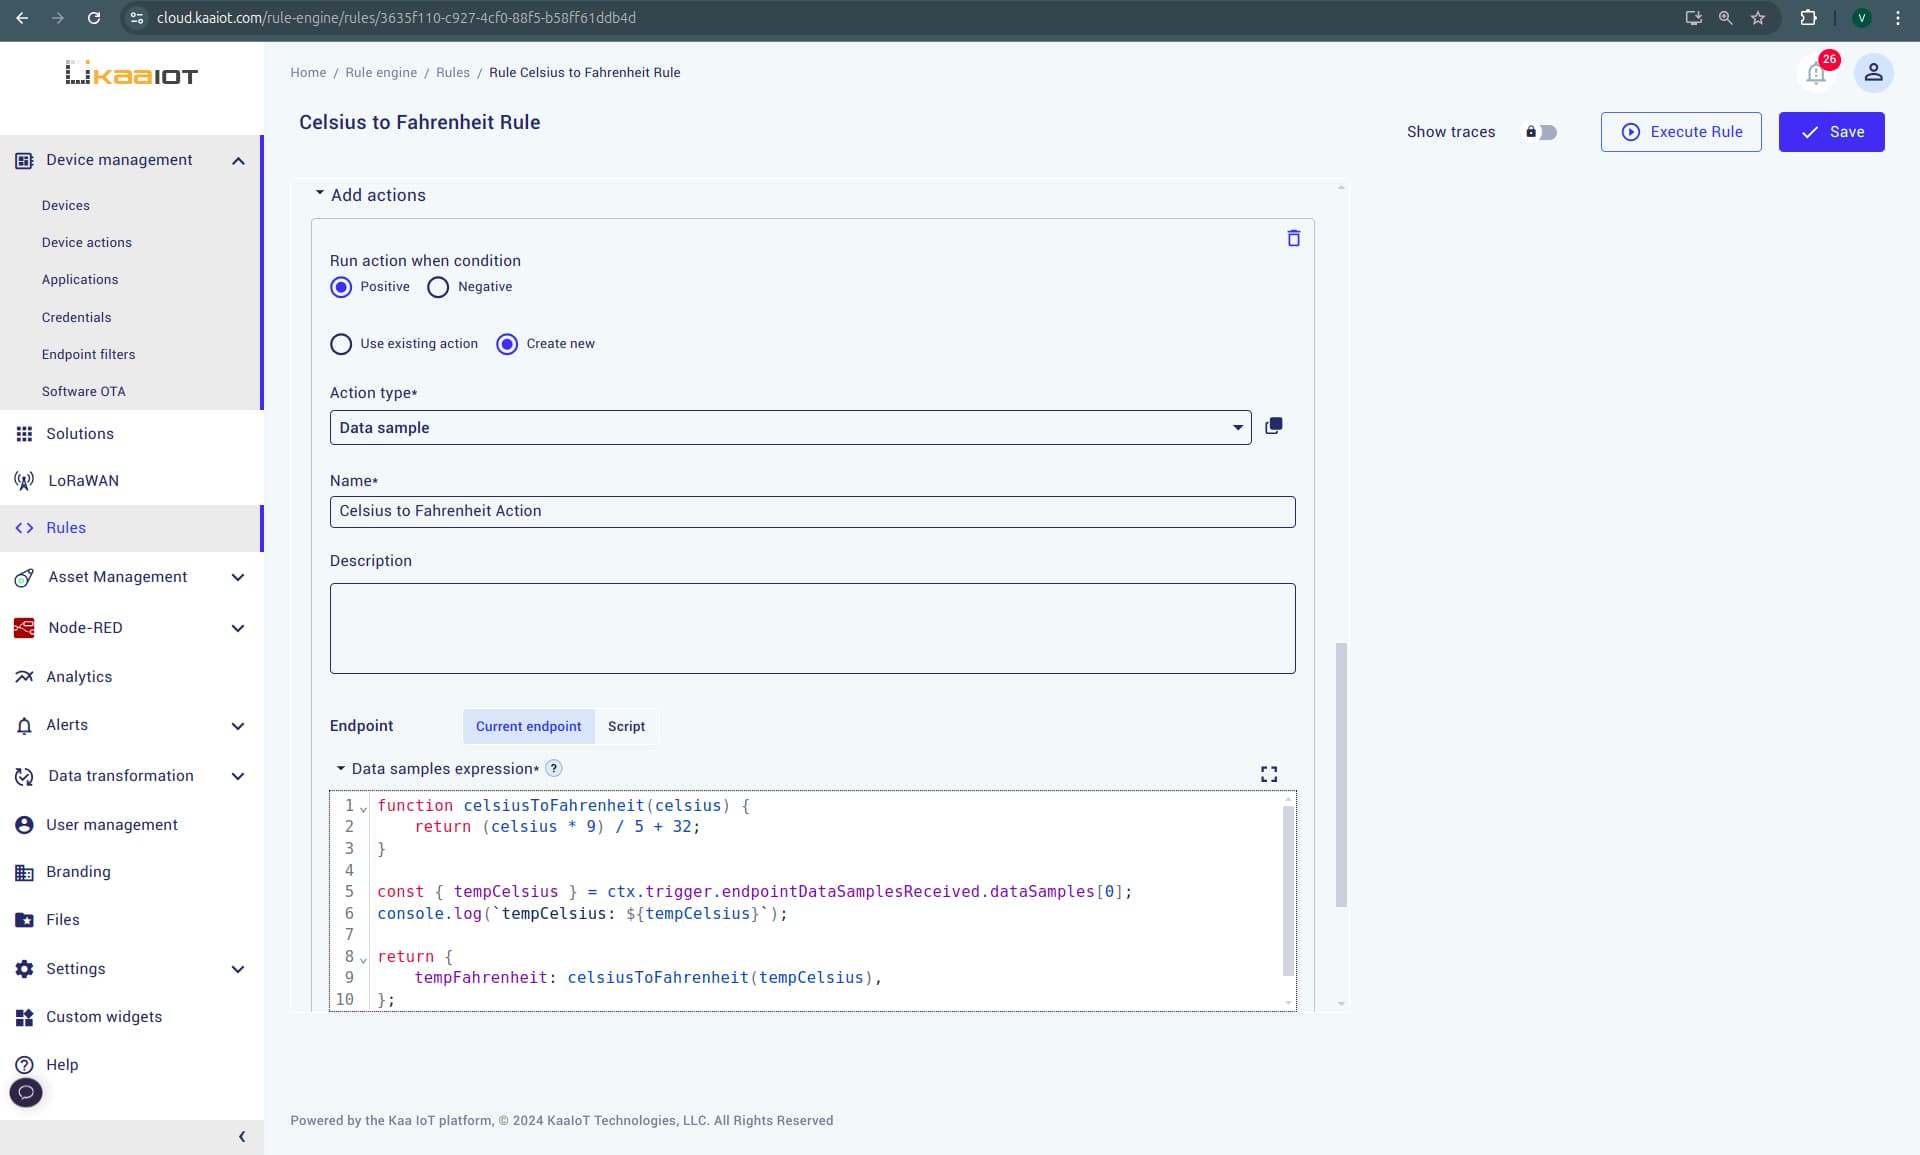
Add an Action
Note: If you’re unfamiliar with actions, you can learn more here.
Scroll down to create the action.
- Set the Action Type to
Data Sample. - Provide a Name for the action.
- Paste the following code into the action body:
function celsiusToFahrenheit(celsius) {
	return (celsius * 9) / 5 + 32;
}

const { tempCelsius } = ctx.trigger.endpointDataSamplesReceived.dataSamples[0];
console.log(`tempCelsius: ${tempCelsius}`);

return {
	tempFahrenheit: celsiusToFahrenheit(tempCelsius)
};
This code takes the tempCelsius directly from JSON you sent earlier, converts it to Fahrenheit, and generates a new data sample, which will be transformed into auto~tempFahrenheit time-series.
Now when rule and corresponding action are configured, save the rule by clicking Create in the top-right corner.
Note: For more information on Rule Engine actions, refer to the Rule Engine Actions documentation.
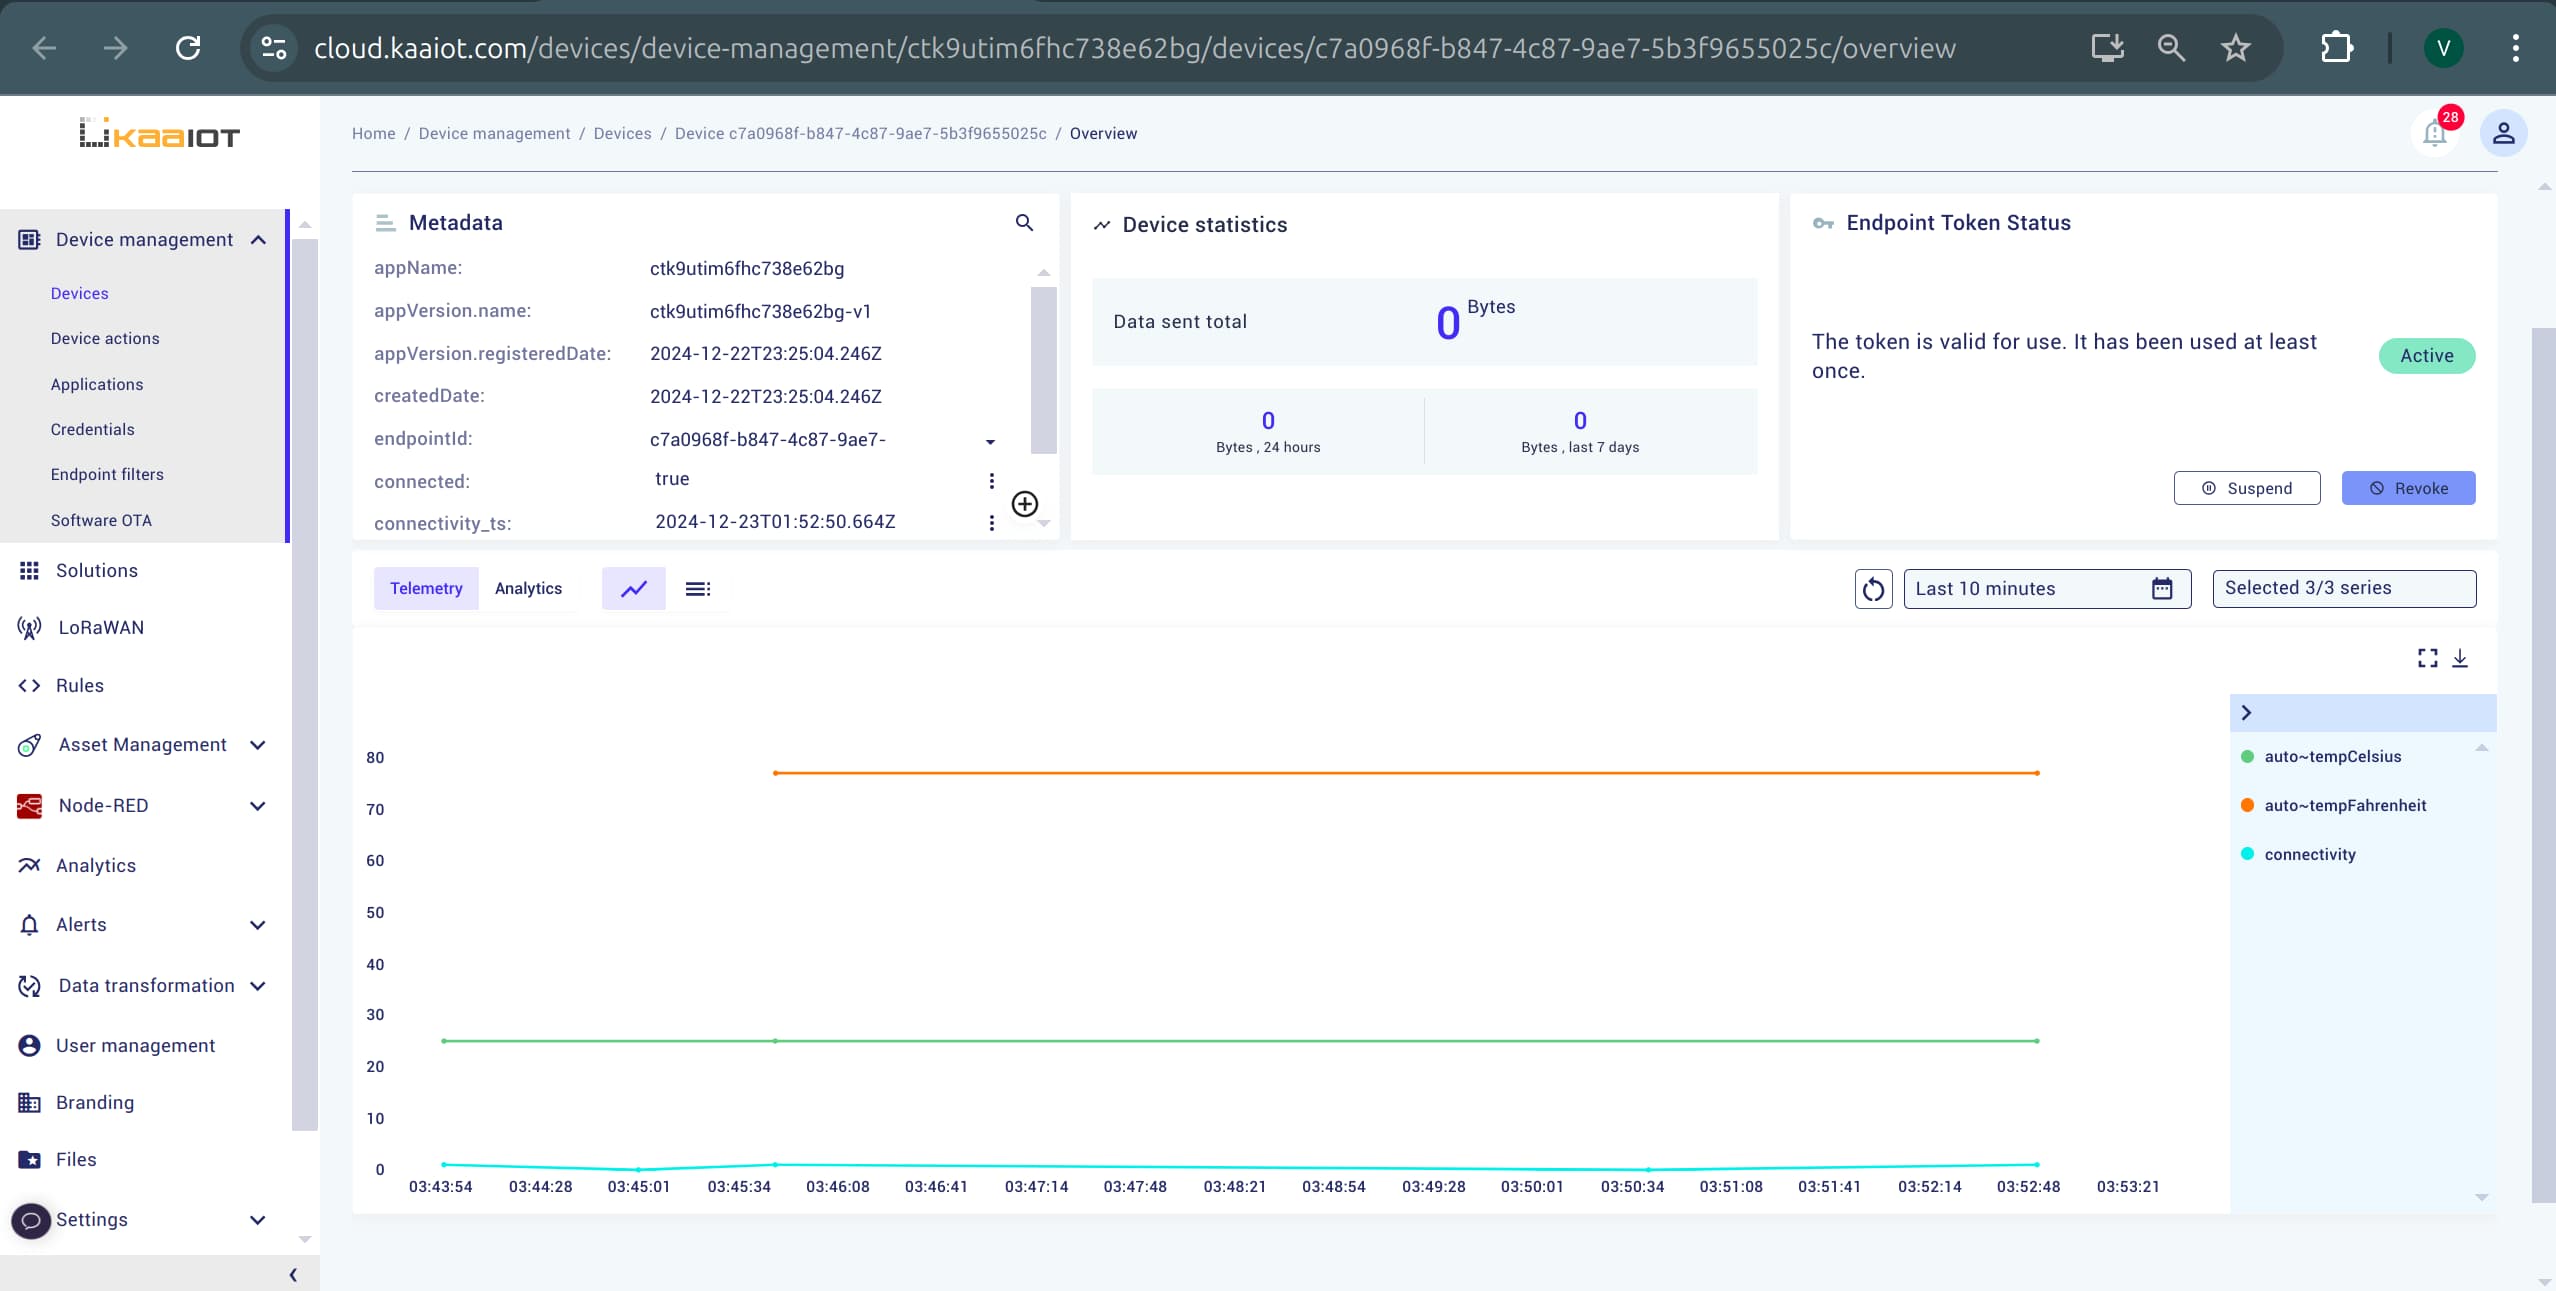
Test Example 1
To test the rule we need to send data through “Data Publish” tool. Navigate back to the “Data Publish” page and send a new data sample like it was described before.
After sending the data, return to the “Device” page and check the chart.
You should now see the new param auto~tempFahrenheit appeard.
Refer to the Troubleshooting section below if the data transformation doesn’t work as expected.
Example #2: Calculating Battery Power
This example is very similar to the first one except this time we have data sample with two fields.
We will create a rule to transform data from a battery sensor.
This rule calculates power by using the voltage and current values.
Example Setup
Repeat the initial setup. For “Data Publish” use this JSON payload instead:
{
  "voltage": 3.5,
  "current": 0.1
}
Create a New Rule
Most of the steps for creating this rule are the same as in the first example.
Follow the instructions in Example 1 to create the trigger and condition.
The only difference is the action where we handle different data sample.
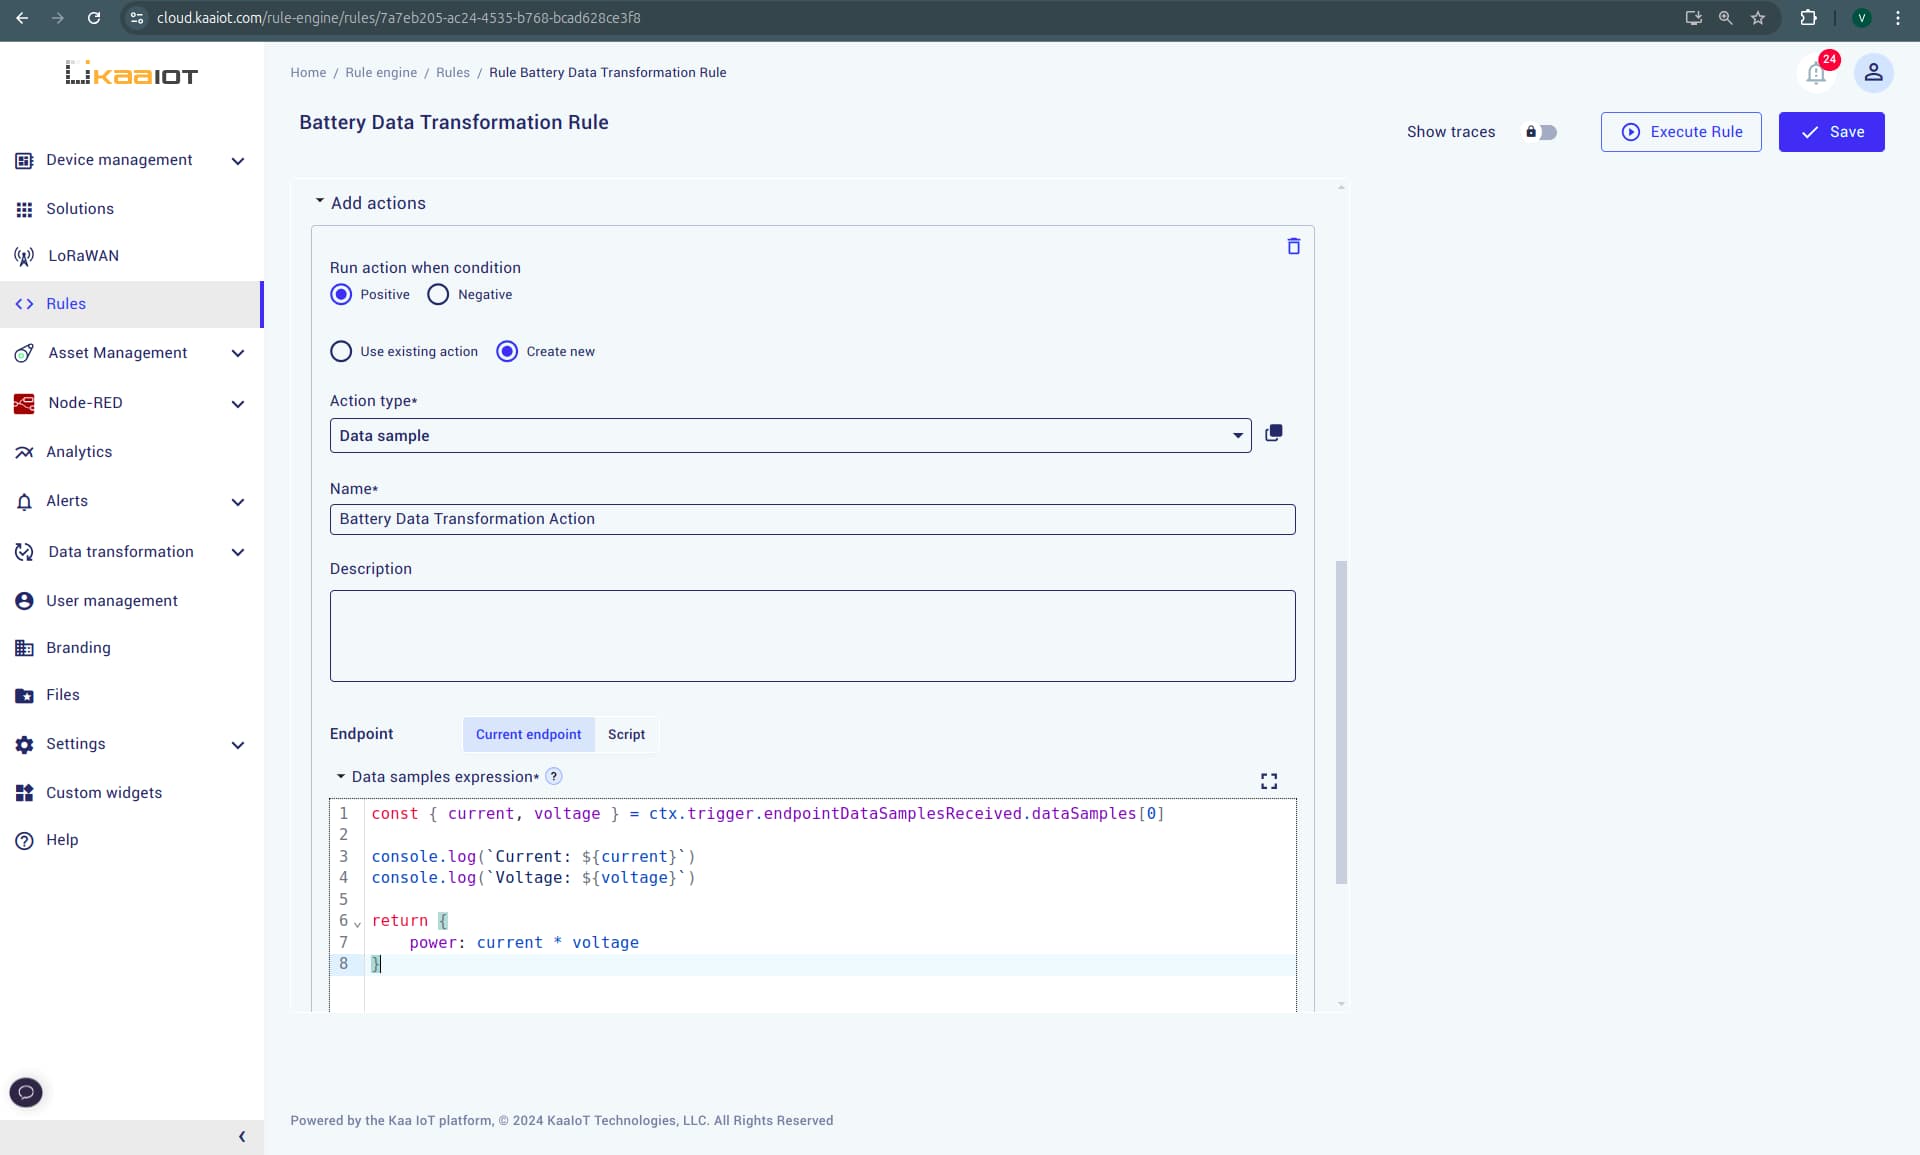
Add Action
Scroll down to create the action.
This step is similar to action from Example 1, but with a different code:
const { current, voltage } = ctx.trigger.endpointDataSamplesReceived.dataSamples[0];

console.log(`Current: ${current}`);
console.log(`Voltage: ${voltage}`);

return {
    power: current * voltage
}
This code extracts voltage and current directly from JSON you sent earlier, calculates the power, and creates a new data sample, which will be transformed in the auto~power time series with the help of Auto-extract feature.
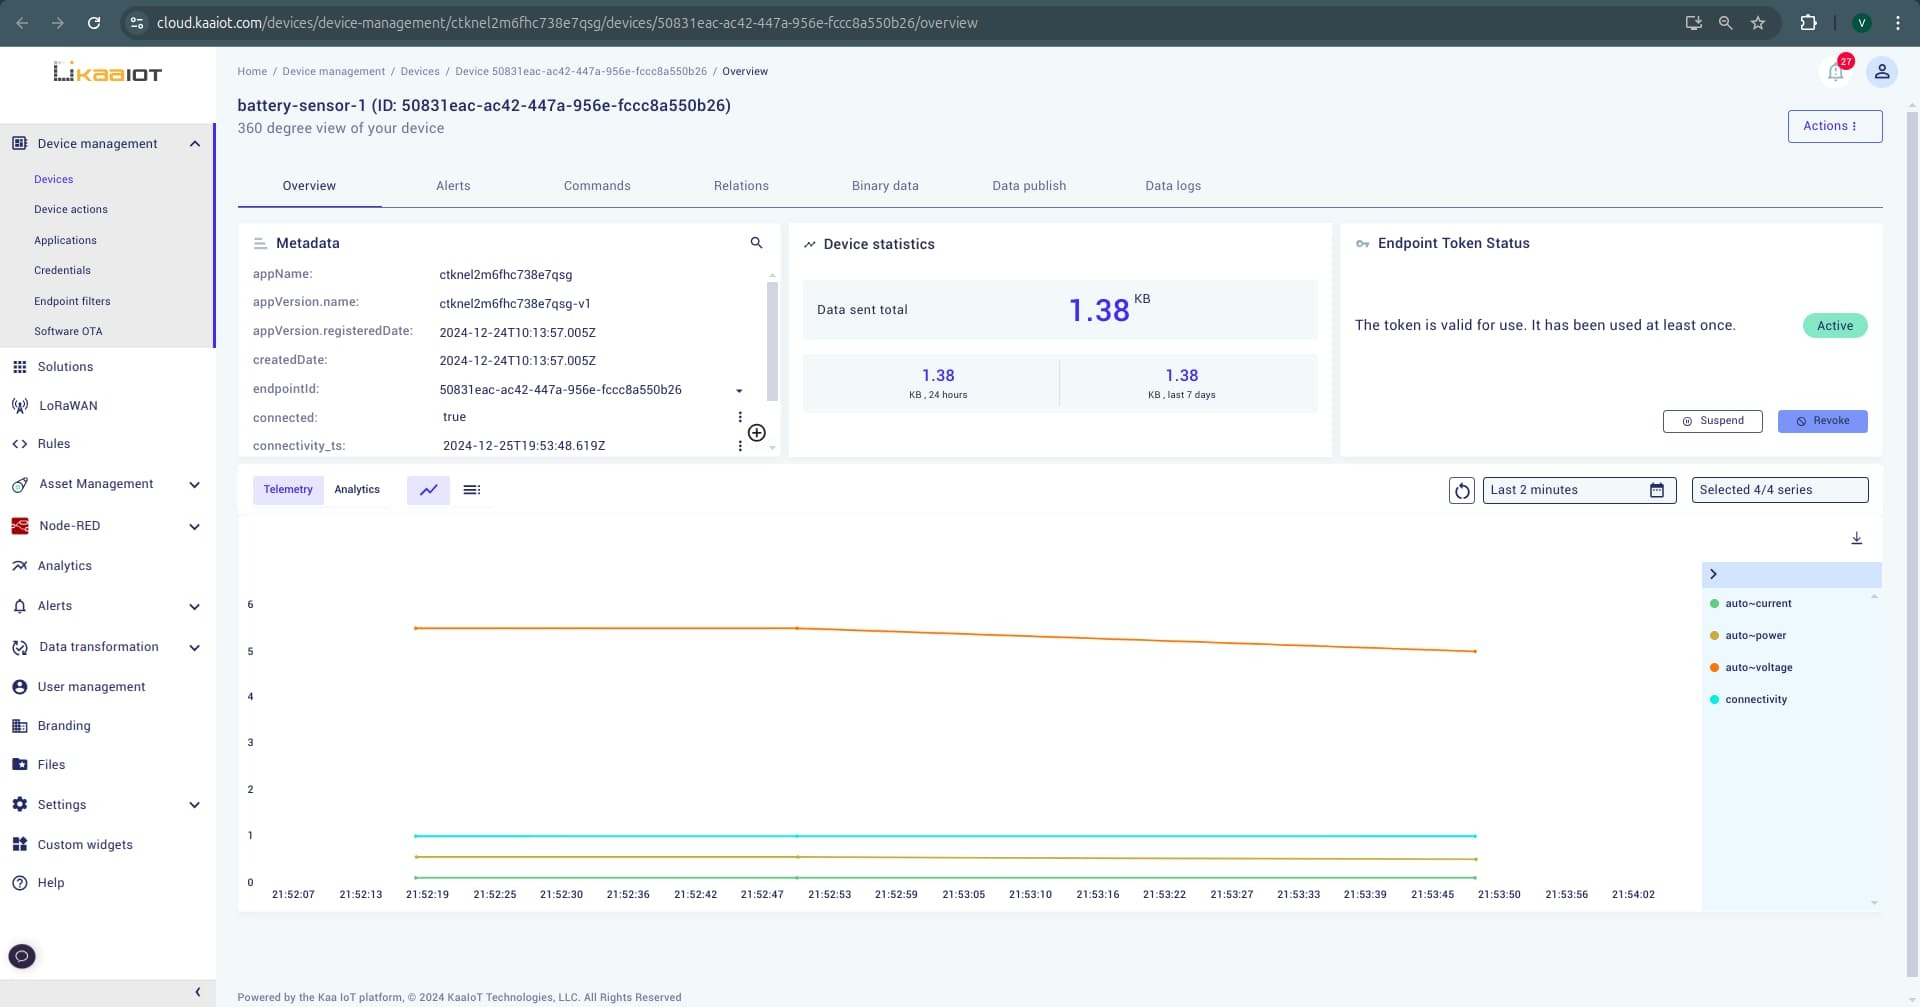
Test Example 2
Let’s run the rule.
Navigate back to the “Data Publish” page and send a new data sample.
After sending the data, return to the “Device” page and check the chart.
You should now see the new param auto~power appeared.
Example #3: Flatten Incoming Data Sample
This rule flattens the received data sample payload and outputs the result to Kaa.
It is useful when you’re unable to modify the payload on the device side.
Example Setup
Repeat the initial setup. For Data Publish use this JSON payload instead:
{
	"DEVICE_DATA": [
		{
			"temperature_c": 45,
			"combustion_power_mw": 0.61,
			"lambda": 1.05,
			"fuel_inputs": {
				"fuel_power_mw": 30.26,
				"solid_1_2_kg_s": 28.75,
				"liquid_gas_kg_s": 1.51,
				"solids_ratio": 0.6,
				"g_l_ratio": 0.083
			}
		}
	]
}
If you send a payload like this, no data will be written to the endpoint. When such a payload is sent, it will not appear in your endpoint graphs because, by default, Kaa extracts data only from the first level of the object’s hierarchy.
To successfully save data to an endpoint, Kaa expects the object to be flattened:
    [
		{
			"temperature_c": 45,
			"combustion_power_mw": 0.61,
			"lambda": 1.05,
            "fuel_power_mw": 30.26,
            "solid_1_2_kg_s": 28.75,
            "liquid_gas_kg_s": 1.51,
            "solids_ratio": 0.6,
            "g_l_ratio": 0.083

		}
	]
So our goal is to write a rule that flattens the payload and outputs this data to Kaa.
Create a New Rule
Most of the steps for creating this rule are the same as in the first example.
Follow the instructions in Example 1 to create the trigger and condition.
The only difference is the action where we handle different data sample.
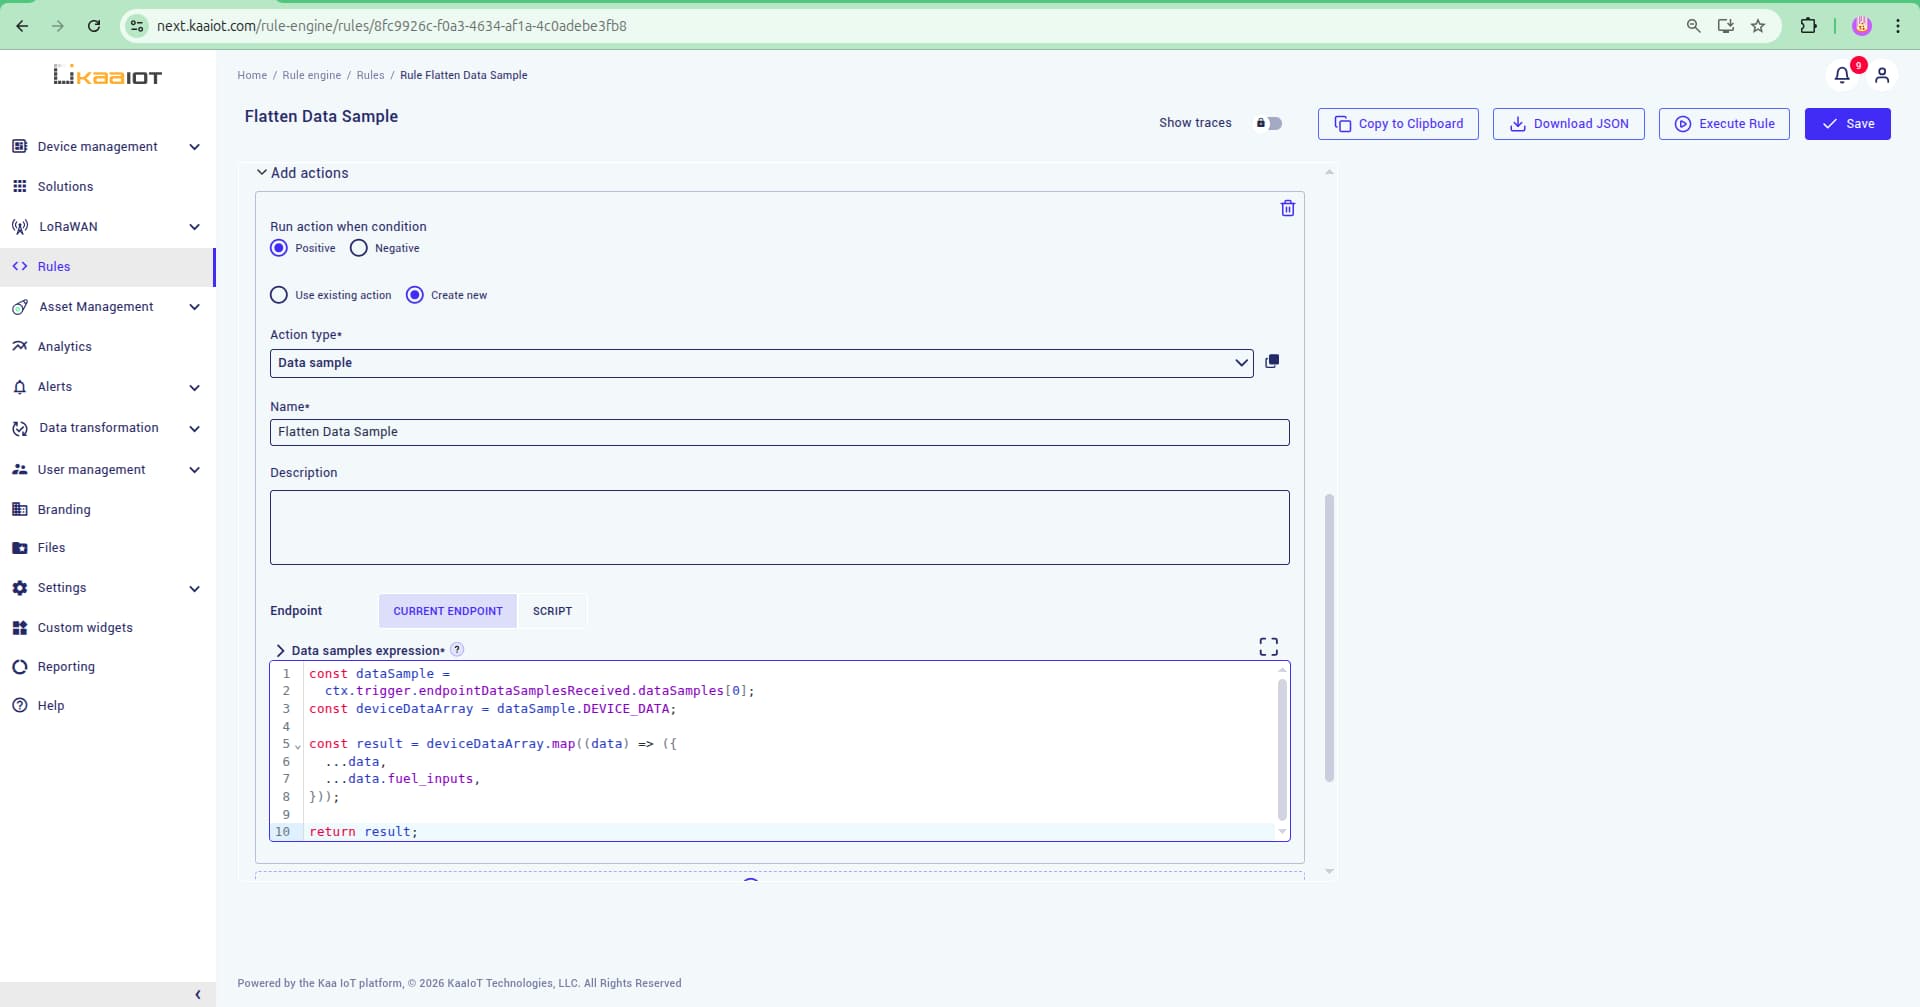
Add Action
Scroll down to create the action.
This step is similar to action from Example 1, but with a different code:
const dataSample =
  ctx.trigger.endpointDataSamplesReceived.dataSamples[0];
const deviceDataArray = dataSample.DEVICE_DATA;

const result = deviceDataArray.map((data) => ({
  ...data,
  ...data.fuel_inputs,
}));

return result;
This code extracts nested data and flattens the object.
Of course, for different objects, you would need to apply a different algorithm.
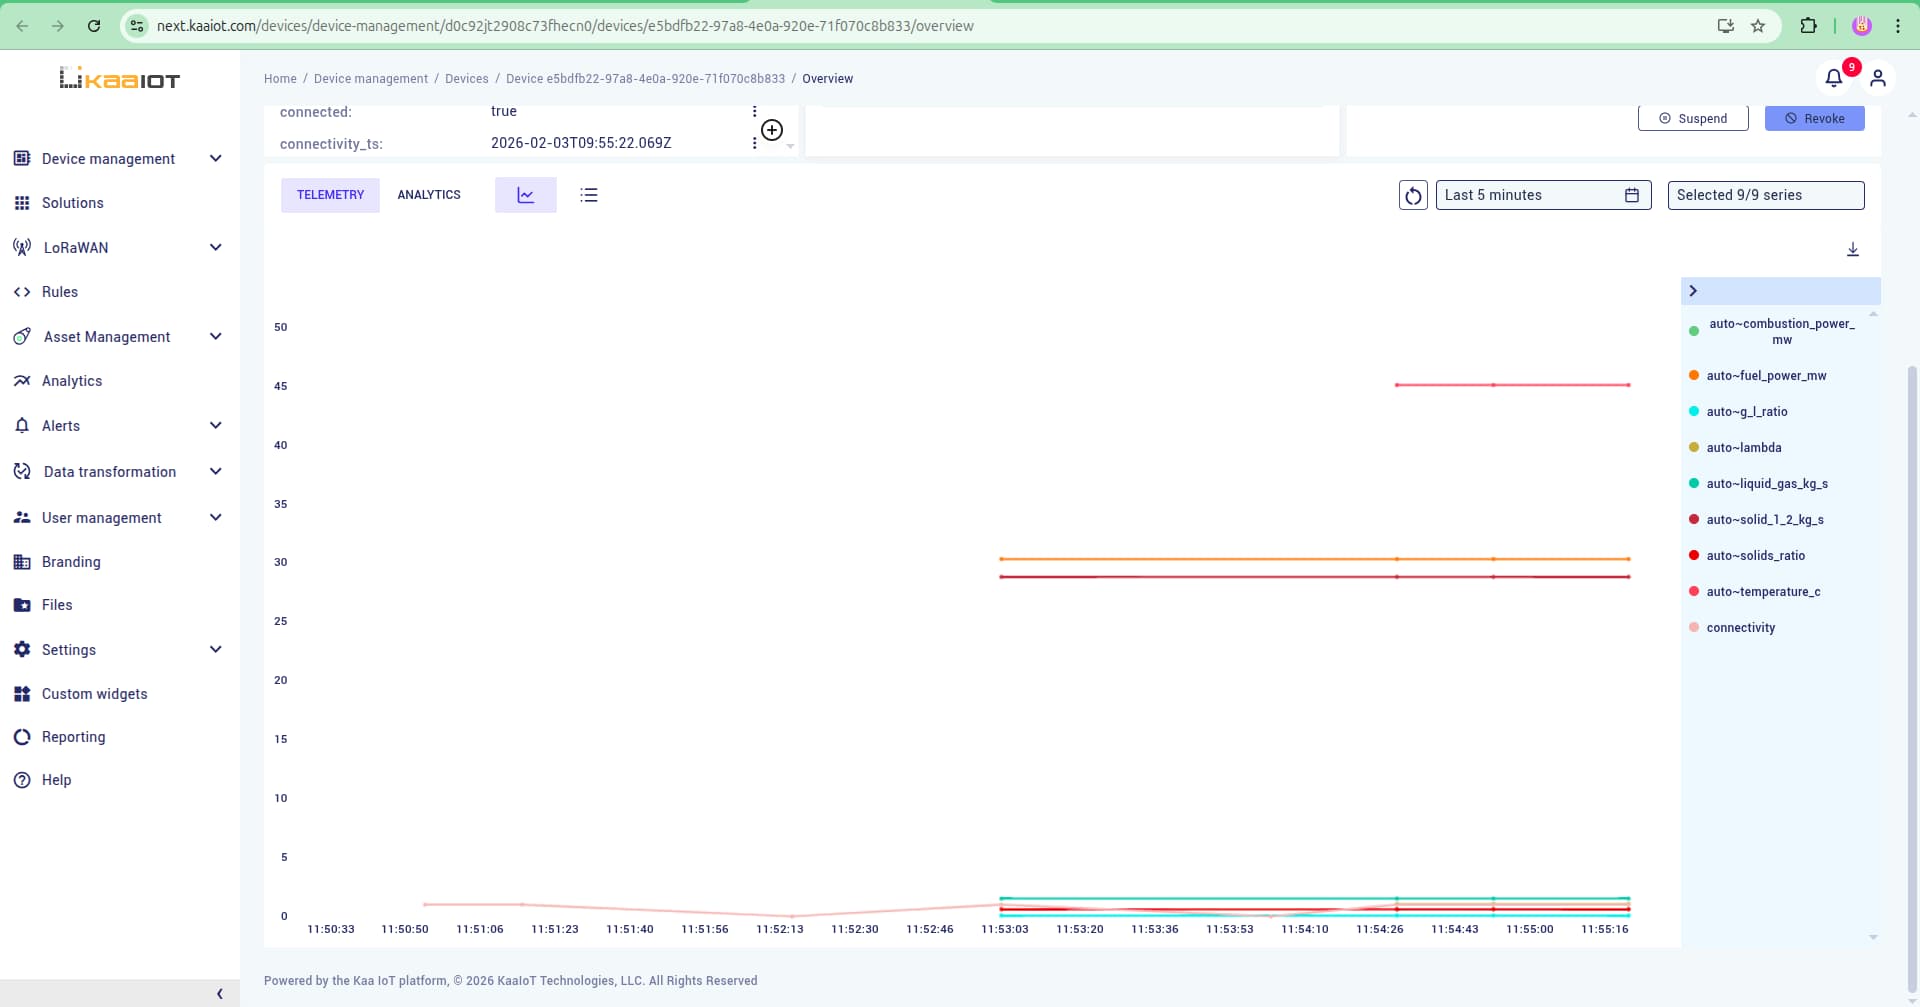
Test Example 3
After sending the data sample, navigate back to the device “Overview” page to verify that the data was received.
The received data will be displayed on the “Telemetry” widget.
Troubleshooting
If the data transformation doesn’t work as expected, follow these steps for verification and debugging:
Go to “Rules” -> “Tracing”.
Here, you can view debug information on rule and their action execution, which is essential for debugging errors.
Click on the trace to get more info.
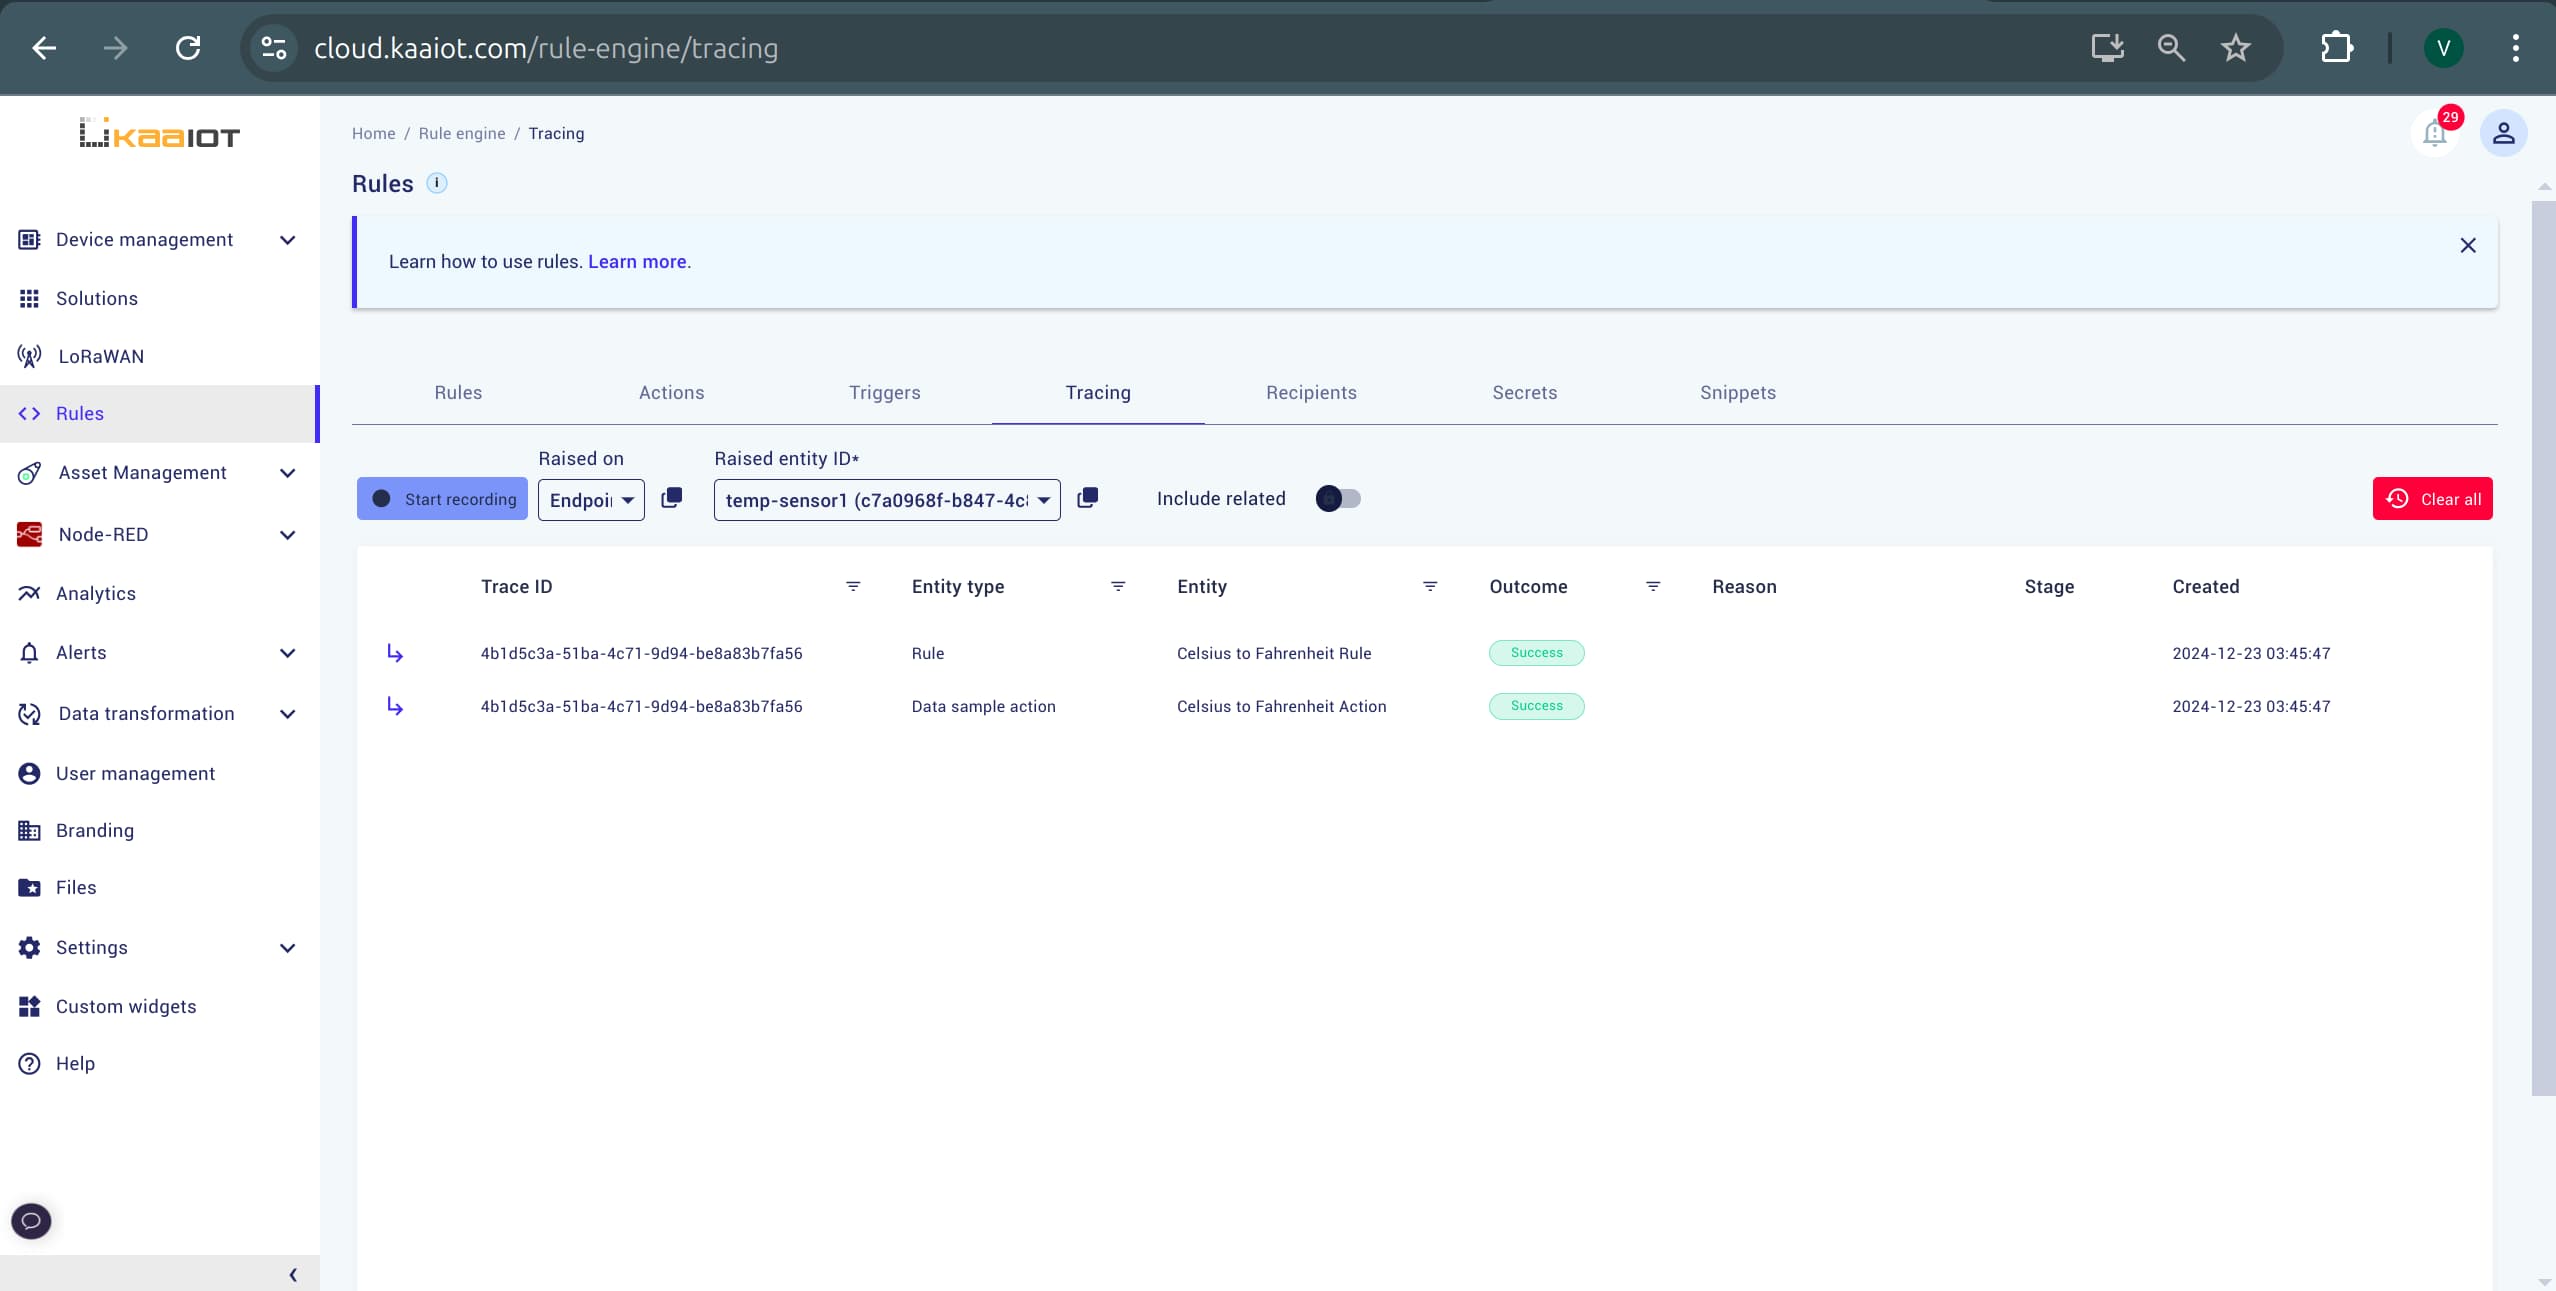
Refer to the Rule Engine Tracing documentation for in-depth guidance on debugging and troubleshooting your rules.