Problems most often ignored in solar monitoring
January 21, 2026The global energy transition toward solar photovoltaics (PV) has been one of the few unequivocal success stories of the 21st century. Solar PV capacity has expanded rapidly, bringing affordable clean energy to homes, businesses, and grids worldwide. In the United States, solar installations are among the fastest-growing segments of the electricity mix, with solar providing around 7% of total electricity generation in 2024 – up from less than 1% a decade ago and accounting for the majority of new capacity installed in 2024.
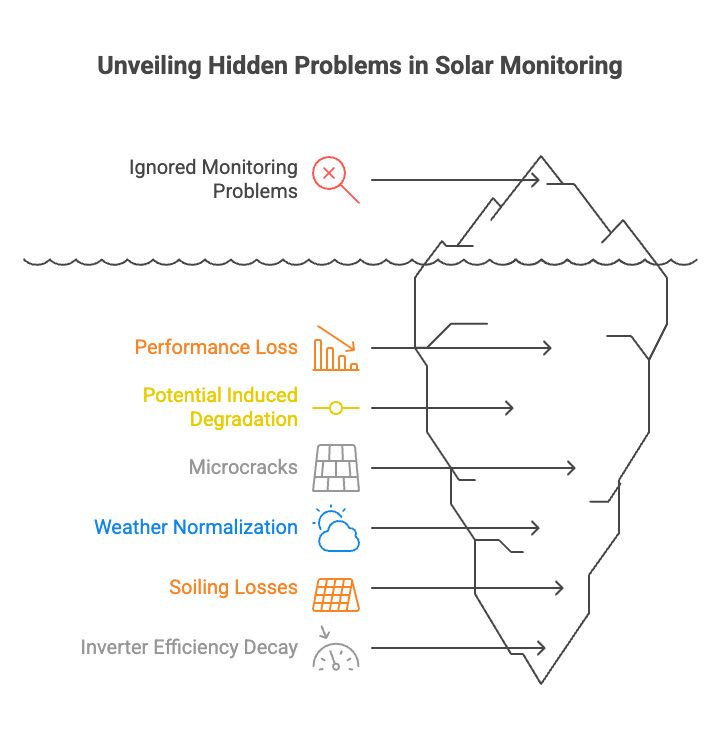
Yet as solar deployment continues its meteoric rise, a crucial truth emerges: visibility does not equal understanding. Most array operators and asset managers focus on real-time dashboards: daily energy output, inverter status, and alerts when a string goes offline. These are necessary but far from sufficient when it comes to identifying and diagnosing the most impactful sources of performance loss in modern PV systems. Many critical phenomena remain invisible unless proper long-term monitoring, advanced analytics, and pattern recognition are in place.
Let's take a look at the five most common problems in solar monitoring that are routinely overlooked or misinterpreted, why they matter, and how better monitoring strategies reveal hidden losses before they erode ROI.
Performance loss and long-term degradation: what the numbers say
Solar PV systems do degrade over time. This fact isn’t controversial, but the rate, causes, and consequences of performance loss are often misunderstood. According to recent industry analysis, most high-quality crystalline PV modules degrade at approximately 0.4%- 0.8% annually under normal operating conditions, and many still retain approximately 80%-85% of their original output after 25 years of service.
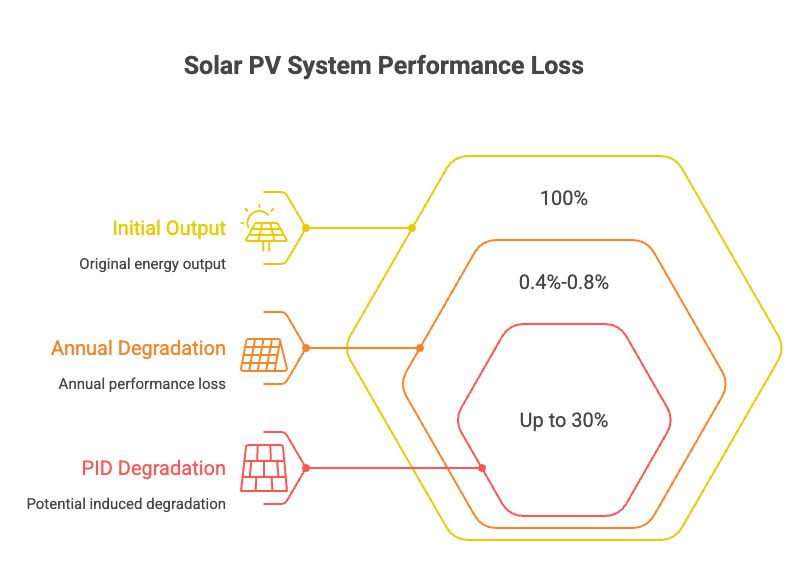
But that average masks a powerful reality: not all degradation follows a simple straight line, and not all losses are due to material aging alone. Some diminishing performance drivers (PID, microcracks, soiling, and inverter inefficiencies) can introduce non-linear, episodic, or weather-masked loss patterns that basic trending fails to capture.
This is where advanced monitoring separates reporting from diagnostics.
1. Potential Induced Degradation (PID): the silent performance killer
Potential Induced Degradation (PID) has been known in photovoltaic research since the early 2010s, yet it remains one of the most underdiagnosed forms of degradation in installed systems. PID is caused by high system voltages and leakage currents that create a potential difference between the PV module and ground. Over time, this drives ions and charges in ways that permanently reduce module output, sometimes by as much as 30% in extreme cases. Most inverter dashboards and string health indicators track instantaneous voltages, currents, and uptime, but they do not track cumulative degradation linked to PID physics. Instead, operators see a gradual tapering of output and typically attribute it to weather, seasonal flux, or “normal wear and tear.” In reality, unmitigated PID can quietly sap yield over months and even years without ever triggering a conventional fault code.
What makes PID especially insidious is its tendency to accelerate in specific environmental conditions (high humidity, elevated temperatures, and prolonged negative potential to ground), none of which appear as “errors” in typical SCADA alarms. Only when a system persistently underperforms its theoretical production in similar irradiance and temperature conditions does the shadow of PID become visible .The takeaway is clear: effective detection requires trend-based anomaly models that correlate voltage stress characteristics with long-term output divergence, not just momentary thresholds.
2. Microcracks: hidden structural faults that only show up in patterns
Solar panels undergo considerable stress during transport, installation, and operation. Wind loads, thermal cycling, snow loads, and even mechanical installation stresses can induce microcracks within individual cells or across strings. On the surface, microcracks do not trigger outright failures; cells continue to produce, and inverters remain operational, but the effect on performance is tangible and measurable.
The key challenge is that microcracks manifest as subtle, irregular losses. They do not cause a single failing string or a clear error code. Instead, microcracks distort the current-voltage (I-V) behavior of cells in ways that incrementally reduce efficiency over time. Without advanced pattern recognition, which is cross-comparing similar weather days, analyzing the distribution of I-V metrics across strings, and isolating unexpected variability in performance indices, microcracks appear as noise in the data rather than a signal worth investigating. As a result, asset owners often treat them as statistical variance rather than as actionable degradation.
3. Weather normalization: why “bad weather” is not an excuse for poor monitoring
One of the most pervasive issues in solar performance analysis is the tendency to attribute nearly all output shortfalls to weather effects. After all, irradiance, temperature, and cloud cover are the most significant immediate drivers of power output. But this is precisely why proper weather normalization is essential: comparing raw output without adjusting for irradiation and temperature leads to false conclusions. A drop in production on an overcast day might be weather-driven, or it might be the first outward sign of a deeper issue masked by meteorological variation.
Sophisticated performance models normalize measured output against expected performance under identical weather conditions using historical baselines and irradiance models. Only by accounting for the impact of weather can real losses be distinguished from environmental noise. Improper normalization effectively turns weather into a catch-all excuse and hides lingering performance degradations that would otherwise stand out as discrepancies between expected and actual production.
4. Soiling losses: more than just dirty panels
Soiling, the accumulation of dust, dirt, bird droppings, pollen, and other particulates on panel surfaces, has long been recognized as a production deterrent. Global studies estimate that average soiling-induced power losses can be 3-5% annually when systems are not cleaned optimally. In dry, dusty, or arid environments, soiling losses can reach even higher percentages. According to ResearchGate, uncleaned systems showed annual degradation rates upwards of 0.8 % to 1.6 %, much of which was due to optical loss from surface dust rather than intrinsic panel aging.
Despite this, many monitoring approaches do not isolate soiling effects. Instead, panel output is compared against weather data without factoring in the gradual optical attenuation due to surface contamination. Rainfall is often used as a de facto cleaning event, but rainwater alone does not always restore panels to a truly clean state, especially in areas with sticky deposits or industrial pollutants. Modern monitoring systems should use soiling ratios and deposition trend lines to quantify accumulation rates, trigger optimal cleaning interventions, and accurately partition output loss between soiling and true module degradation.
5. Inverter efficiency decay: the invisible loss between DC and AC
Inverters are the heart of energy conversion in a PV system, yet they are often treated as black boxes in performance monitoring. Dashboard data usually reports inverter status (on/off) and instantaneous AC output, but not the degradation of conversion efficiency over time. In practice, inverters experience slight declines in DC-to-AC conversion efficiency as they age. Heat cycling, component wear, capacitor aging, and firmware limitations can reduce performance incrementally. While a 1 % loss in conversion efficiency may seem small in isolation, over a multi-year horizon, it significantly impacts cumulative energy yield.
Because standard monitoring frequently overlooks these efficiency trends, asset owners mistakenly lump inverter losses into other categories or ignore them entirely. Integrated analyses that track DC input vs AC output metrics normalized to weather conditions can reveal efficiency flattening long before an inverter fails outright. Understanding this subtle decay enables proactive maintenance and potentially extends inverter life with firmware updates or cooling enhancements.
Two essential lists for smarter solar monitoring
What a high-quality monitoring system should provide:
- Normalization of production data against weather and irradiance baselines.
- Long-term trend analysis that isolates gradual degradation from normal variance.
- Anomaly detection models sensitive to PID, microcracks, and soiling patterns.
- Cross-string and cross-inverter comparative analysis.
- Alerts based on performance deviation rather than threshold violations.
Common misinterpretations in standard dashboards:
- Attribution of all output drops to weather without normalization.
- Treating slight annual degradation as “expected” without causal investigation.
- Ignoring soiling effects until production becomes visibly low.
- Overlooking inverter efficiency decay because the unit has not failed outright.
- Disregarding string-level divergence in favor of aggregated plant output.
Using advanced remote monitoring with KaaIoT
The limitations of traditional solar monitoring, basic dashboards, and simple error alerts necessitate more advanced solutions that blend telemetry, analytics, and actionable insights. This is precisely the challenge addressed by remote solar energy monitoring platforms such as the one offered by KaaIoT. Our remote solar energy monitoring solution captures detailed time-series data, applies normalization and anomaly detection algorithms, and helps operators identify hidden degradation mechanisms well before they impact performance materially. By incorporating comprehensive analytics and data science techniques, operators can uncover performance problems such as PID, soiling buildup, structural anomalies, and inverter efficiency loss, turning data into foresight rather than reactive maintenance.
Conclusion
Solar monitoring must evolve from observation to diagnosis. Daily production figures and inverter logs tell us what happened, but only deep, normalized, trend-based analysis tells us why. The challenges outlined (PID, microcracks, weather misattribution, soiling losses, and inverter efficiency decay) are not anomalies; they are fundamental aspects of real-world PV system performance. Standard dashboards were never designed to spot these issues early. Advanced monitoring, particularly solutions that merge telemetry with analytics, reveals hidden patterns and enables better operational decisions. Only by recognizing and addressing what is currently ignored can solar operators safeguard ROI, extend asset life, and truly maximize the promise of photovoltaic energy in the global clean energy transition.

