How to build IoT dashboards that turn data into decisions
October 07, 2025Think about how much data your IoT devices are producing right now. Thousands of sensor readings per second, streams of logs, alerts, and metrics from machines, vehicles, or energy assets. The numbers themselves don’t mean much until you can actually see them, understand them, and act on them. That’s where dashboards step in.
Have you ever looked at a generic chart and thought, “Okay, but what am I supposed to do with this?” That’s the trap many companies fall into when they rely on one-size-fits-all tools. A basic graph might tell you the temperature of a machine, but does it also help you compare performance across your entire plant, or show how downtime is affecting production? A custom dashboard does exactly that: it organizes data around your business goals, not just raw values.
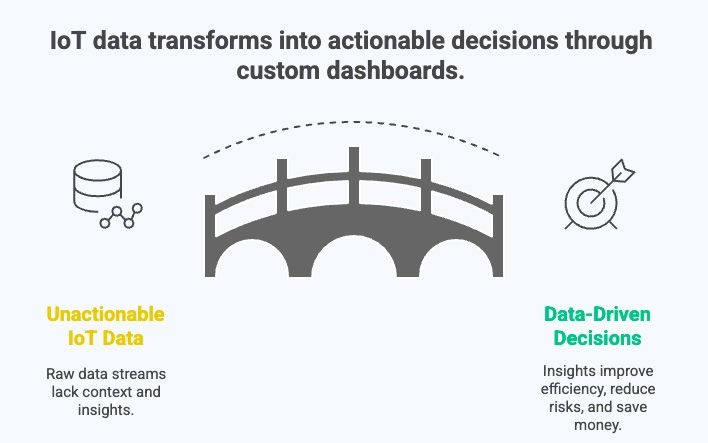
The truth is, IoT dashboards are not about pretty visuals. They’re about turning complex streams of data into decisions that save money, improve efficiency, and reduce risks. For a fleet operator, that might mean knowing which EVs are ready to roll at the lowest charging cost. For an energy company, it could be spotting the exact time when solar output peaks so storage can be optimized. The point is simple: without a dashboard, IoT data is just noise. With the right dashboard, it becomes your most valuable asset.
What is an IoT dashboard?
At its simplest, an IoT dashboard is a control panel for your connected world. It’s where raw data from sensors, devices, and machines gets translated into something humans can actually use: charts, maps, alerts, and key performance indicators. Instead of scrolling through endless logs, you see a clear picture of what’s happening right now and what requires your attention. But here’s the catch: not all dashboards are created equal. Off-the-shelf solutions may appear polished, but they often fall short when it comes to meeting real business needs.
For example, a generic dashboard might display temperature readings from dozens of sensors, but what if you also need to track anomalies across multiple production lines or overlay those readings with cost data from your ERP system? That’s where customization makes all the difference. Think of a dashboard as more than just a visualization tool. A well-designed IoT dashboard is directly connected to your operational goals, including uptime, energy efficiency, compliance, safety, and customer satisfaction. It highlights what matters, hides the noise, and helps different teams see the same truth, but in the language they understand.
Core requirements for a custom IoT dashboard
When building a custom IoT dashboard, it’s easy to get caught up in visuals: colors, charts, and widgets. But the real foundation lies in the functional requirements. A dashboard that looks slick but doesn’t scale, update in real time, or provide secure access will quickly become a liability. Let’s break down the essentials every serious IoT project should account for.
Real-time visibility
IoT is all about immediacy. Whether it’s a machine overheating, a fleet vehicle low on charge, or an air quality sensor spiking, you can’t afford to wait for delayed updates. A proper dashboard needs to stream data in near real time, so that the moment something changes in the physical world, it’s reflected instantly on-screen. This reduces response time and turns monitoring into proactive action.
Scalability
A proof-of-concept dashboard showing ten sensors is one thing; running the same system for thousands or millions of devices is another. Scalability isn’t just about storage capacity. It’s about making sure your dashboard can handle growing data volume without slowing down, and that your architecture supports horizontal expansion when new devices, geographies, or business lines come online.
Role-based views
Not everyone needs to see the same information. Operators want granular details: temperatures, voltages, error codes. Managers are more interested in KPIs like uptime, throughput, or energy costs. Executives care about financial performance and compliance. A solid IoT dashboard allows you to define roles and create segmented views, so that each user sees exactly what helps them make decisions, without drowning in irrelevant data.
Multi-device access
Work doesn’t happen only at a desk. A dashboard should work seamlessly across desktops, tablets, and mobile devices, ensuring that engineers in the field or executives traveling abroad have the same clarity as someone in a control room. Responsive design, lightweight queries, and offline modes are not “nice to have”; they’re baseline requirements in modern deployments.
Security and compliance
Finally, none of the above matters without security. IoT dashboards often expose sensitive operational and customer data, which means strong authentication, encryption, and role-based access controls are non-negotiable. On top of that, industries such as healthcare, finance, and energy must ensure compliance with strict standards like HIPAA, GDPR, or ISO 27001. Building compliance from the start saves both money and reputation later.
You can find examples of our IoT dashboards here:
IoT Energy Asset Management Dashboard
Air Quality Monitoring and Management Dashboard
Building blocks of a custom IoT dashboard
Behind every clean visualization lies a complex system of moving parts. A dashboard is the end result of data traveling through multiple layers of technology, each one playing a specific role. Understanding these layers helps avoid bottlenecks and ensures your dashboard can grow with your IoT project.
The first building block is data ingestion. Devices need a way to send their signals into the platform, whether that’s through protocols like MQTT, CoAP, or Modbus, or via custom APIs. This step is about reliability; no matter how unstable the network or how remote the device, data must reach the system. Once inside, storage becomes the next priority. Most IoT platforms rely on time-series databases optimized for fast reads and writes, as traditional relational systems can’t keep up with the constant updates from sensors.
Processing and analytics form the next layer. Raw data doesn’t add value until it’s cleaned, processed, and analyzed. Stream processing engines can flag anomalies in real time, while machine learning models can forecast demand, detect failures before they happen, or optimize resource use. This is where the shift happens from passive monitoring to active decision-making.
Finally, all of this work is made useful through visualization and integration. The dashboard is a window, but it should also be a bridge to other enterprise systems. For most organizations, that means connecting with ERP, BMS, or CRM platforms. To summarize, the building blocks that matter most are:
- data ingestion through open protocols;
- scalable and optimized storage systems;
- analytics engines for real-time and predictive insights;
- visualization tools that deliver clarity;
- integration layers that tie everything into the business workflow.
Together, these elements ensure that an IoT dashboard is an operational tool that closes the loop between connected devices and business outcomes.
Steps to designing an IoT dashboard
Building a dashboard is less about picking charts and more about designing a tool that supports decision-making. The process works best when it follows a clear sequence, where each step builds on the last. Too often, companies skip straight to visuals and end up with cluttered screens that look impressive but fail to guide real actions. A structured approach avoids this pitfall and ensures that the dashboard speaks the language of the business.
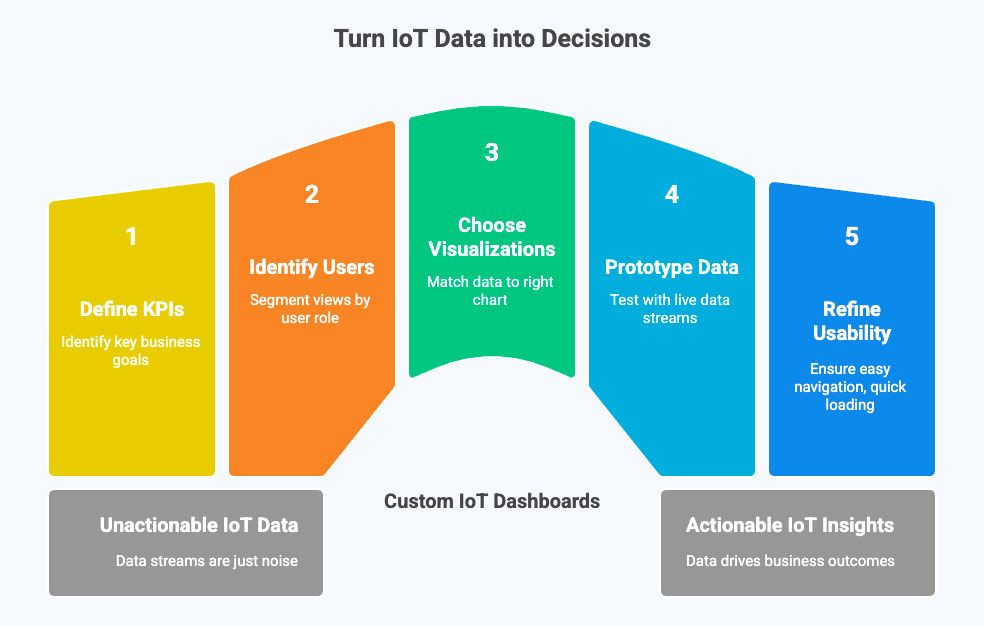
Here’s a practical roadmap most successful IoT teams follow:
- Define the use cases and KPIs. Start by asking what problems the dashboard should solve. Is it monitoring machine uptime, tracking energy efficiency, or ensuring fleet availability? Defining the goal upfront shapes every decision that follows.
- Identify the users and roles. Operators, managers, and executives don’t need the same level of detail. Designing role-based views prevents dashboard fatigue and ensures the right person sees the right data.
- Choose the right visualization types. Line charts highlight trends, gauges display thresholds, heat maps show utilization, and alerts flag anomalies. Matching data to the right visualization makes insights intuitive instead of confusing.
- Prototype with real data. Wireframes are useful, but until you test with live data streams, you won’t know how the dashboard performs in practice. Early feedback from users helps refine design choices before full rollout.
Refine usability and performance. Beyond accuracy, dashboards must be easy to navigate, quick to load, and responsive across devices. A few seconds of delay or a confusing layout can undermine adoption.
Following these steps turns dashboard design into a repeatable, low-risk process. Instead of guessing what looks good, you focus on what works. The result is not just a collection of widgets but a system that guides day-to-day operations and long-term strategy.
Common pitfalls to avoid
Even the best-intentioned dashboards can fall short if a few common traps aren’t avoided. One of the biggest mistakes is trying to display everything at once. Too many widgets and charts create noise instead of clarity, leaving users unsure of where to focus. A good rule is to highlight only what drives action and leave the rest in secondary views. Another frequent issue is presenting raw numbers without context. Seeing that energy use spiked by 20% means little unless you also show how it compares to benchmarks, past performance, or cost implications. Context transforms data into insight.
Latency is another silent killer. If a dashboard refreshes every five minutes while real-world conditions change by the second, users are always behind. Real-time or near-real-time updates should be a non-negotiable requirement. Finally, security is often underestimated. Opening dashboards to multiple teams without role-based controls can expose sensitive information. Building in authentication, encryption, and compliance from the start keeps the dashboard reliable and trusted.
Example use cases of custom IoT dashboards
Dashboards become powerful when they’re tailored to real-world operations. Let’s look at a few practical scenarios where custom IoT dashboards turn raw data into measurable business value.
Energy management
For solar farms or facilities with battery storage, dashboards offer real-time visibility into production, consumption, and storage levels. Operators can track when photovoltaic output peaks, decide when to store or dispatch energy, and align operations with off-peak tariffs. Instead of waiting for monthly reports, with end-to-end energy asset management, they see cost savings and efficiency gains as they happen.
Industrial operations
In manufacturing, industrial IoT platforms consolidate data from machines, sensors, and maintenance systems. This allows plant managers to monitor uptime, detect anomalies, and act on predictive maintenance alerts. A spike in vibration on one machine, for example, might be harmless in isolation but signals an early failure risk when viewed in a broader dashboard. By catching it early, downtime and repair costs are minimized.
Smart buildings
Facility managers often struggle with fragmented systems for HVAC, lighting, and occupancy. A custom smart building solution unifies these streams into a single view, showing energy use per floor, occupancy rates, and environmental conditions. Instead of guessing whether a meeting room is underutilized or an HVAC unit is overworked, they get instant clarity and can act, optimizing comfort while reducing costs.
Fleet management
For logistics and transport operators, fleet management software track vehicle location, charging status, and performance metrics. A fleet of electric vehicles, for example, can be monitored not just for charge levels but also for charging costs relative to tariff schedules. Dispatchers know exactly which vehicles are ready, which need charging, and how to minimize downtime.
Conclusion
Dashboards are the bridge between IoT data and real-world decisions. Without them, even the most advanced sensors and devices end up producing streams of numbers that nobody can act on. With the right dashboard, those numbers transform into insights that guide operators, inform managers, and empower executives to move faster and smarter. The real difference comes from tailoring dashboards to the business. Whether it’s reducing energy costs, predicting machine failures, optimizing space, or managing a fleet, a custom-built dashboard ensures that every user sees what matters most to them. That’s where efficiency, savings, and competitive advantage emerge.
If your IoT project is at the stage where data is flowing but insights are lacking, now is the time to focus on creating effective dashboards. With Kaa, building and scaling them doesn’t have to be complex. See how Kaa IoT dashboards can turn your connected assets into clear, actionable insights.

