How to Add Floor Plan to Smart Building Dashboard: Step-By-Step
Welcome to our comprehensive tutorial, crafted to guide you through the process of showcasing the floor plan of an apartment, accurately positioning sensor locations on an image, and effectively displaying sensor status. Whether you're a seasoned professional or a newcomer to this field, this guide will walk you through each step with clear and concise instructions.
In this tutorial, we'll explore a practical IoT use case. You'll learn how to seamlessly integrate floor plan visualization based on the Vega widget with sensor placement, enabling you to monitor and manage your building management systems efficiently. Thus, we will create a real-time smart building management dashboard powered by the Kaa IoT platform. Additionally, we'll explore the intricacies of device connections, facilitating the assignment of sensors to specific apartments with ease.
Prerequisites:
- Active account in the Kaa IoT Cloud.
- Created Application with Apartments.
- Created Applications with IoT devices (detectors). In the tutorial, we use 3 detectors connected to the Kaa IoT platform.
If you haven't connected a device yet, you can get started on your IoT project by following the 'Connecting your first device’ tutorial.
Smart building dashboard configuration
In this section, we will demonstrate how to utilize the Vega Chart widget and other Kaa IoT widgets to showcase graphics and work with coordinates assigned to endpoint metadata. The basic idea is to create a dashboard that shows a floor plan, sensors, and their current status.
You might also like the Vega Widget Tutorial: Detailed Guide.
#1. Preparing configuration for the Vega Chart widget
Firstly, let's go to the Vega Editor. There, we can see an example of an apartment layout with sensor icons and their statuses.
Please note that this code is written in JSON format, and you will need basic programming skills to work with it.
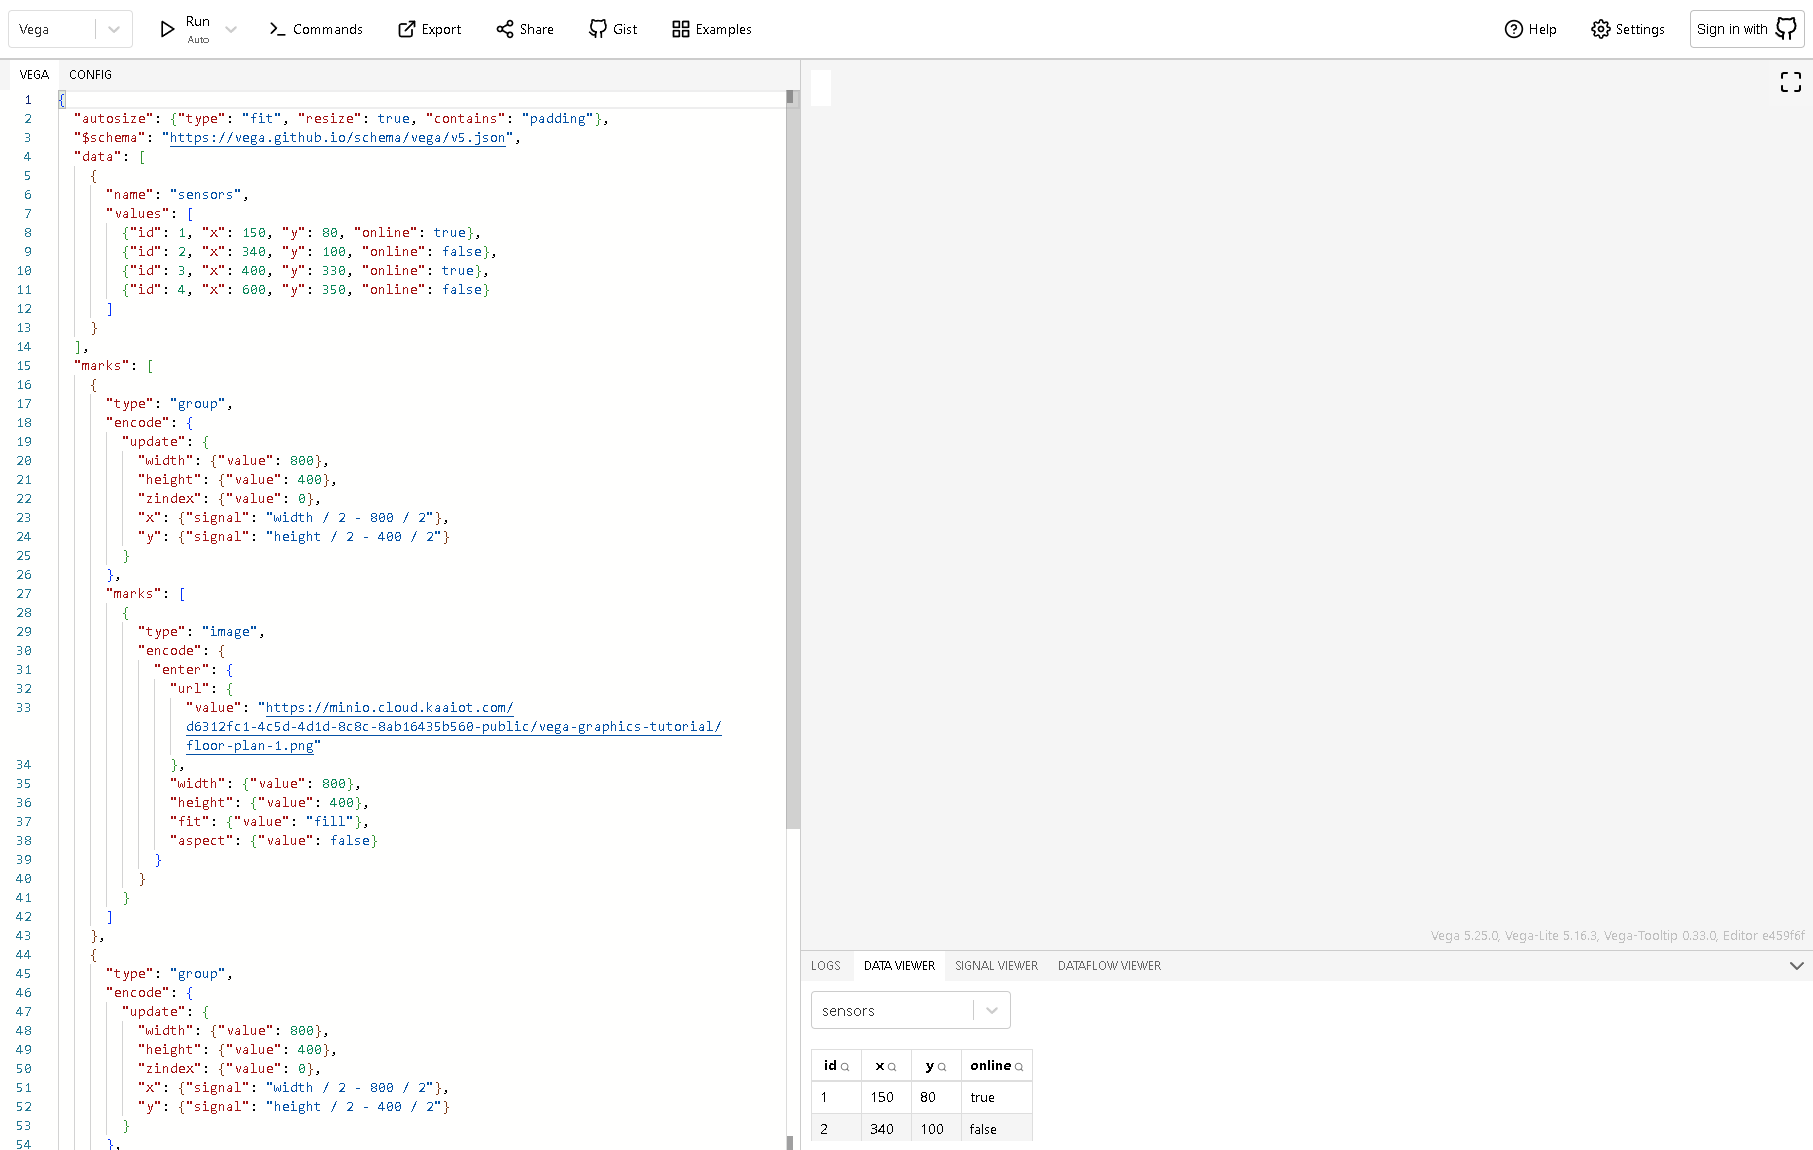
As you have noticed, the Vega Editor is divided into 2 parts: where the left part is the code responsible for the widget parameters, and the right part is the graphical display of the widget. In our case, the following code was used for the correct operation of the widget:
{
  "$schema": "https://vega.github.io/schema/vega/v5.json",
  "width": 1000,
  "height": 600,
  "data": [
    {
      "name": "sensors",
      "values": [
        {"id": 1, "x": 150, "y": 80, "online": true},
        {"id": 2, "x": 340, "y": 100, "online": false},
        {"id": 3, "x": 400, "y": 330, "online": true},
        {"id": 4, "x": 600, "y": 350, "online": false}
      ]
    }
  ],
  "marks": [
    {
      "type": "group",
      "encode": {
        "update": {
          "width": {"value": 800},
          "height": {"value": 400},
          "zindex": {"value": 0},
          "x": {"signal": "width / 2 - 800 / 2"},
          "y": {"signal": "height / 2 - 400 / 2"}
        }
      },
      "marks": [
        {
          "type": "image",
          "encode": {
            "enter": {
              "url": {"value": "https://minio.cloud.kaaiot.com/d6312fc1-4c5d-4d1d-8c8c-8ab16435b560-public/vega-graphics-tutorial/floor-plan-1.png"},
              "width": {"value": 800},
              "height": {"value": 400},
              "fit": {"value": "fill"},
              "aspect": {"value": false}
            }
          }
        }
      ]
    },
    {
      "type": "group",
      "encode": {
        "update": {
          "width": {"value": 800},
          "height": {"value": 400},
          "zindex": {"value": 0},
          "x": {"signal": "width / 2 - 800 / 2"},
          "y": {"signal": "height / 2 - 400 / 2"}
        }
      },
      "marks": [
        {
          "type": "image",
          "from": {"data": "sensors"},
          "encode": {
            "update": {
              "x": {"field": "x"},
              "y": {"field": "y"},
              "width": {"value": 100},
              "height": {"value": 40},
              "url": {
                "signal": "datum. online ? 'https://minio.cloud.kaaiot.com/d6312fc1-4c5d-4d1d-8c8c-8ab16435b560-public/__wd_resources/5f10ea03-ab2a-40da-ae97-c0a02763bfb1.svg' : 'https://minio.cloud.kaaiot.com/d6312fc1-4c5d-4d1d-8c8c-8ab16435b560-public/__wd_resources/0c1c13a9-e797-4f90-ba5d-266faef0f947.svg'"
              }
            }
          }
        }
      ]
    }
  ]
}
Let's look at our code in more detail. This segment is responsible for the coordinates of our sensors on the plane of the apartment plan and their status (online or offline):
"data": [
    {
        "name": "sensors",
        "values": [
        {"id": 1, "x": 150, "y": 80, "online": true},
        {"id": 2, "x": 340, "y": 100, "online": false},
        {"id": 3, "x": 400, "y": 330, "online": true},
        {"id": 4, "x": 600, "y": 350, "online": false}
        ]
    }
],
The next part of the code creates a group of markers that contain a single image and are responsible for displaying the image in the Vega Chart widget on Kaa Cloud. The marker type is defined as "group", which means that this marker can contain other markers. This code is also responsible for the properties of the group, in this case, "width", "height", "zindex", "x" and "y", which are updated at each rendering.
{
    "type": "group",
    "encode": {
    "update": {
        "width": {"value": 800},
        "height": {"value": 400},
        "zindex": {"value": 0},
        "x": {"signal": "width / 2 - 800 / 2"},
        "y": {"signal": "height / 2 - 400 / 2"}
    }
    },
    "marks": [
    {
        "type": "image",
        "encode": {
        "enter": {
            "url": {"value": "https://minio.cloud.kaaiot.com/d6312fc1-4c5d-4d1d-8c8c-8ab16435b560-public/vega-graphics-tutorial/floor-plan-1.png"},
            "width": {"value": 800},
            "height": {"value": 400},
            "fit": {"value": "fill"},
            "aspect": {"value": false}
        }
        }
    }
    ]
},
Let's return to the previous section, namely:
"data": [
    {
        "name": "sensors",
        "values": [
        {"id": 1, "x": 150, "y": 80, "online": true},
        {"id": 2, "x": 340, "y": 100, "online": false},
        {"id": 3, "x": 400, "y": 330, "online": true},
        {"id": 4, "x": 600, "y": 350, "online": false}
        ]
    }
],
To set the exact coordinates of a particular sensor marker on your apartment plan, you need to do the following:
- First, select the coordinates of the sensor you want to set: "id": 1, / "id": 2, / "id": 3, etc.
- After selecting the sensor we can set the values of the coordinates responsible for its location on the virtual floor plan. To do this, you need to change the x and y values.
- For example, let's take sensor number 1. The code responsible for its parameters is as follows:
{ "id": 1, "x": 150, "y": 80, "online": true},
Here, we can see the values of the x and y we mentioned earlier. To move the sensor icon on the plan, you need to set the necessary numerical values that follow the x and y values (in our case, 150 and 80).
#2. Migrate a customized Vega configuration from the editor to the Kaa Cloud
After we've walked you through the basics of the Vega Editor, we can move on to the dashboard of our Kaa Cloud solution. To do this, you need to:
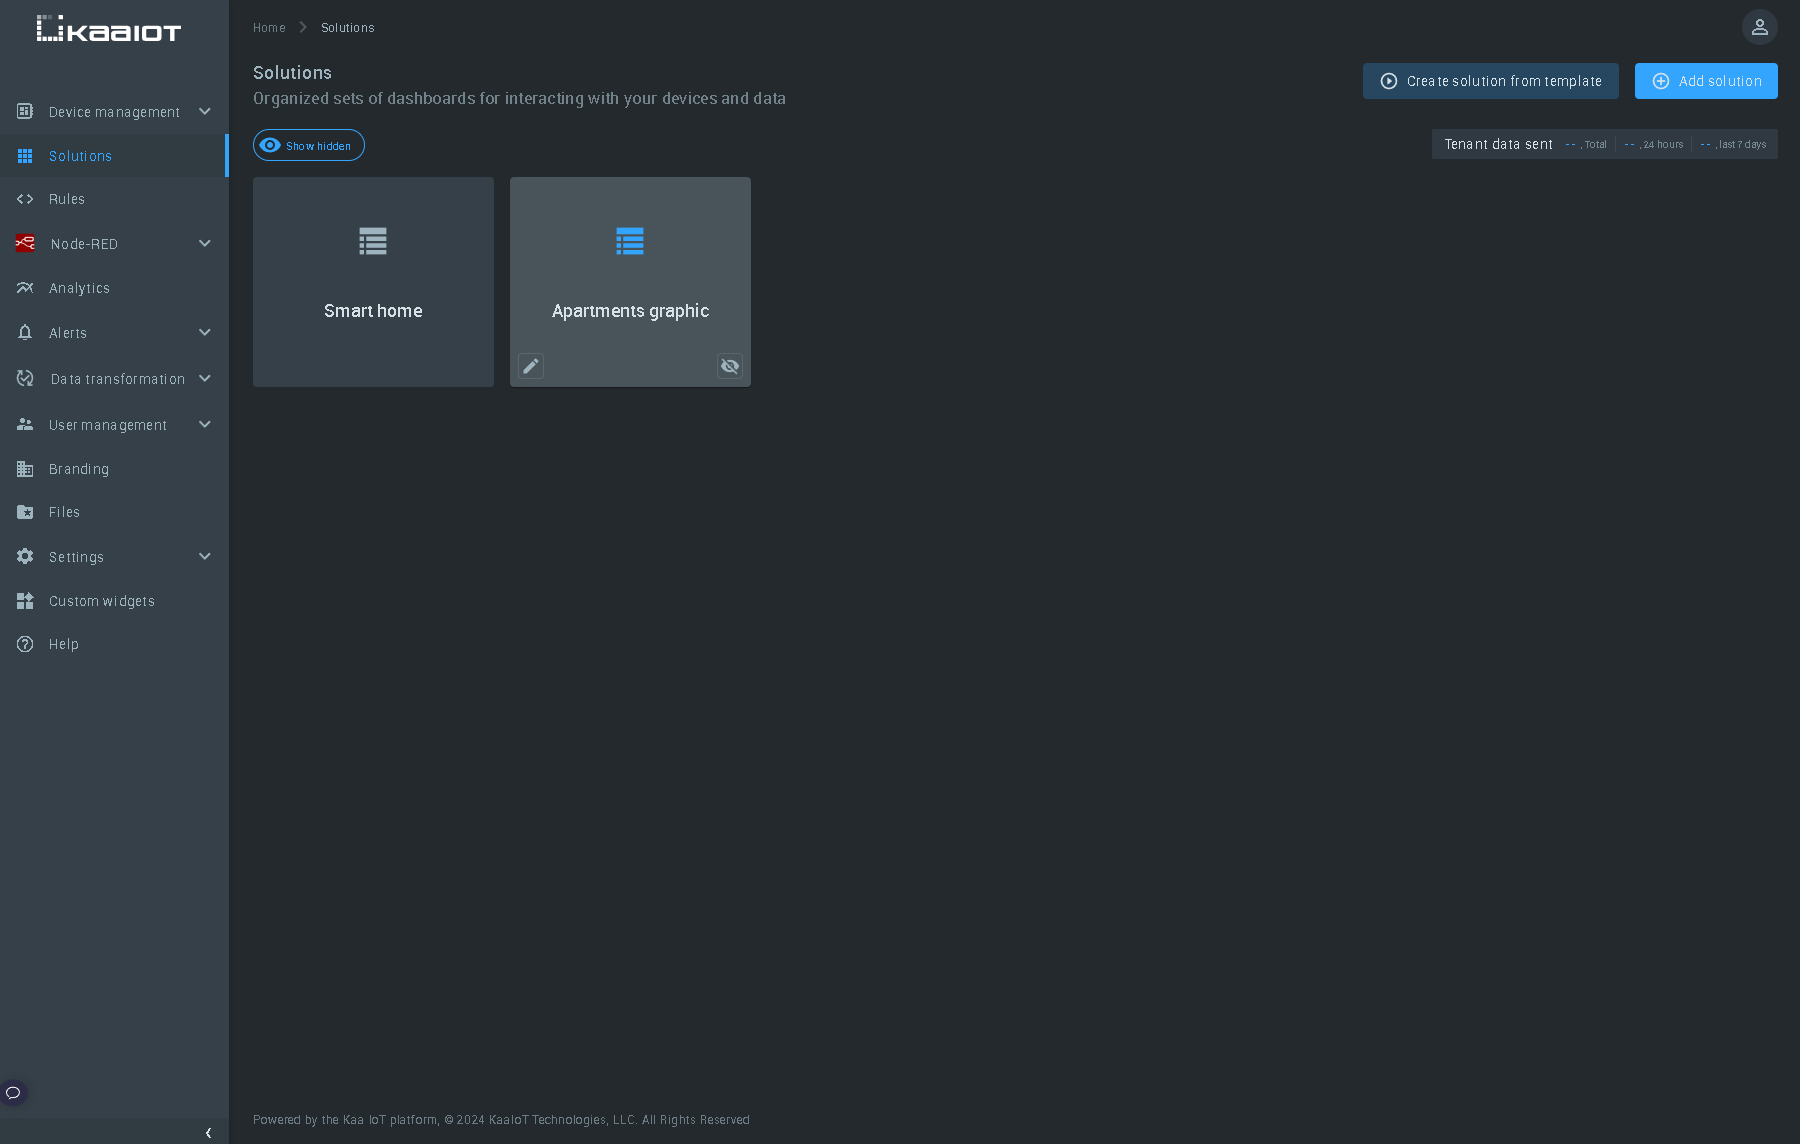
- Go to the Kaa Cloud, login, and go to the Solutions tab.
- On the Solutions tab, select the solution to which you want to add the widget. In our case, the solution is called "Apartments Graphic".
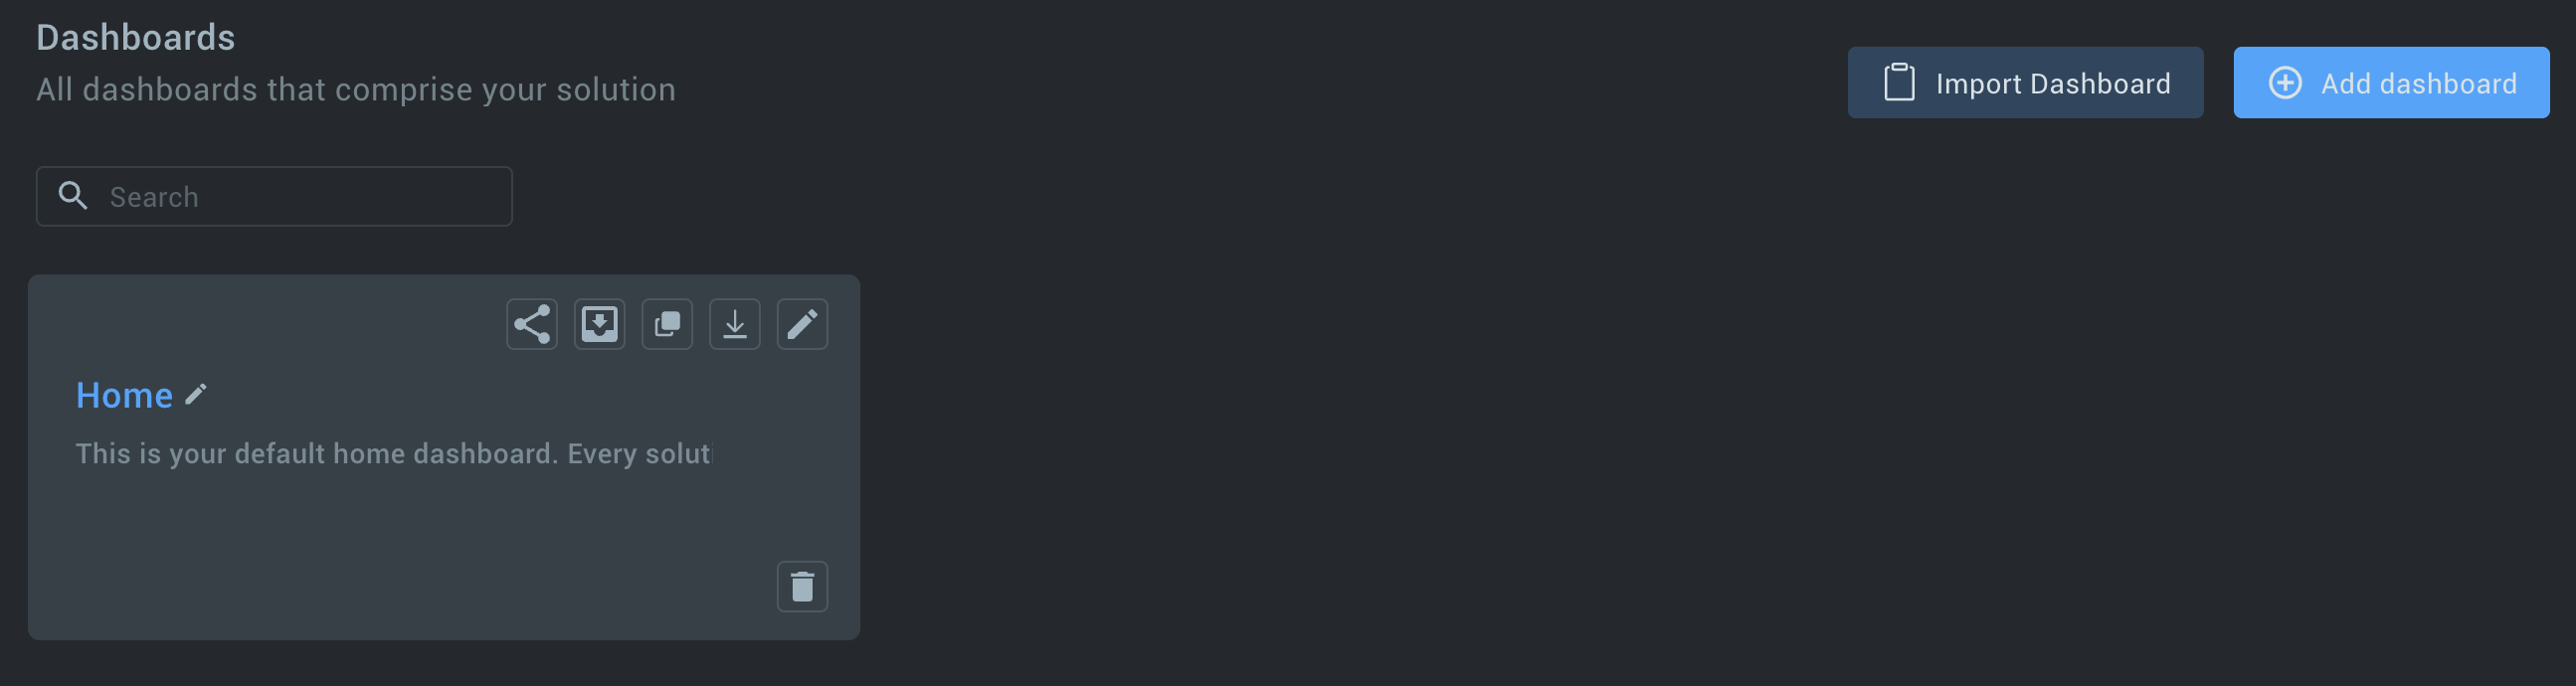
- After choosing a solution, select the dashboard from your list to add the Vega Chart widget. For example, we will choose the standard Home dashboard.
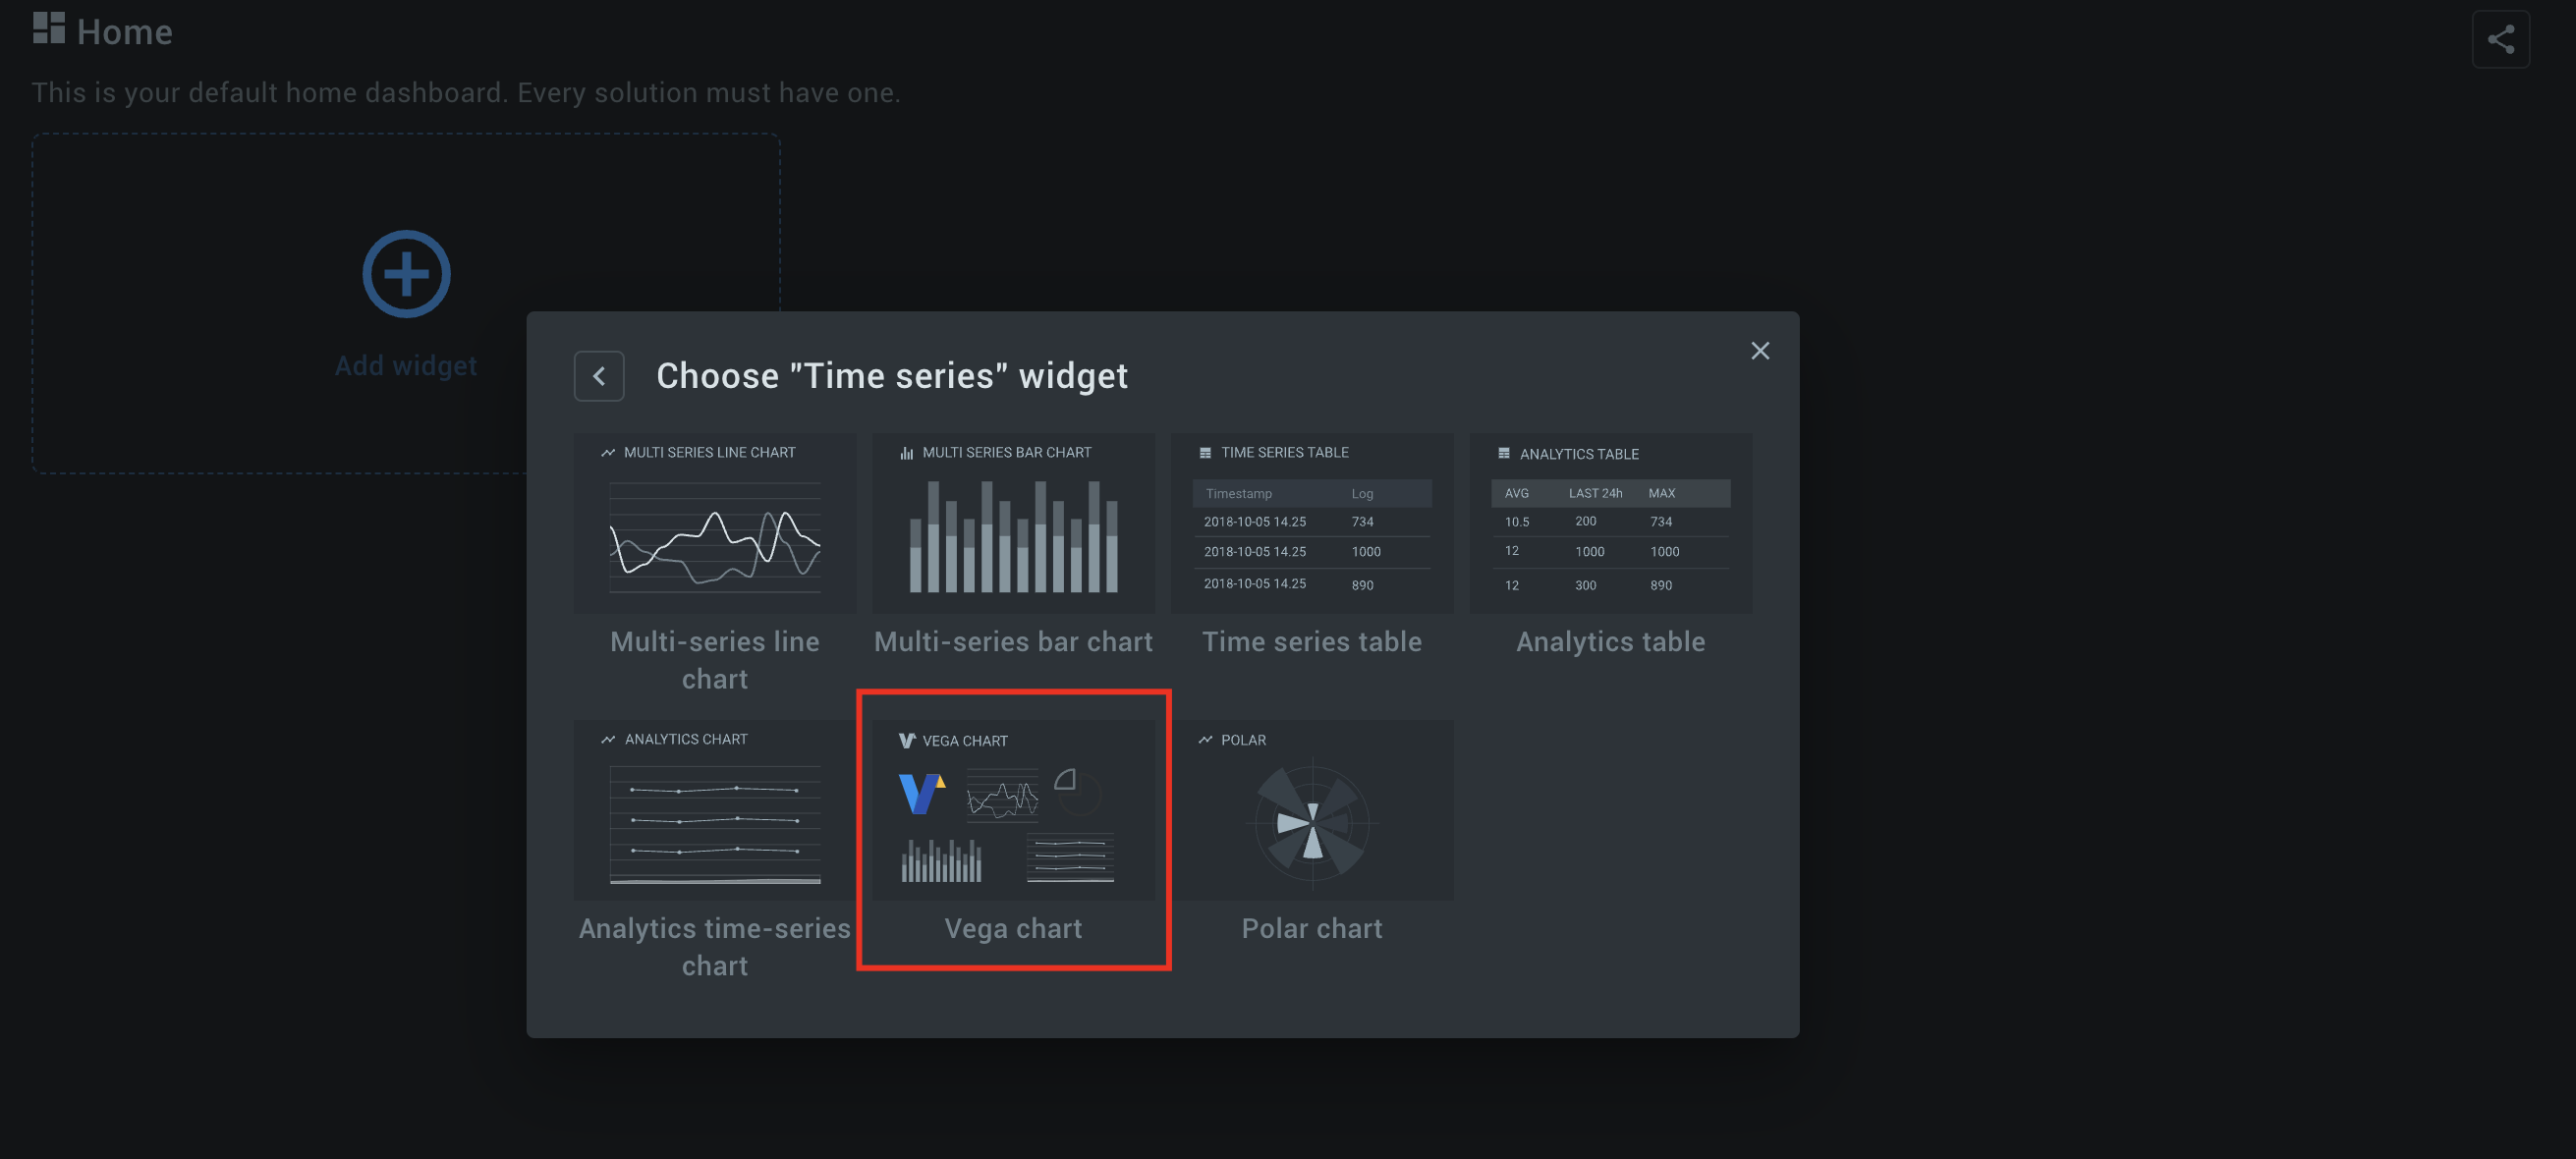
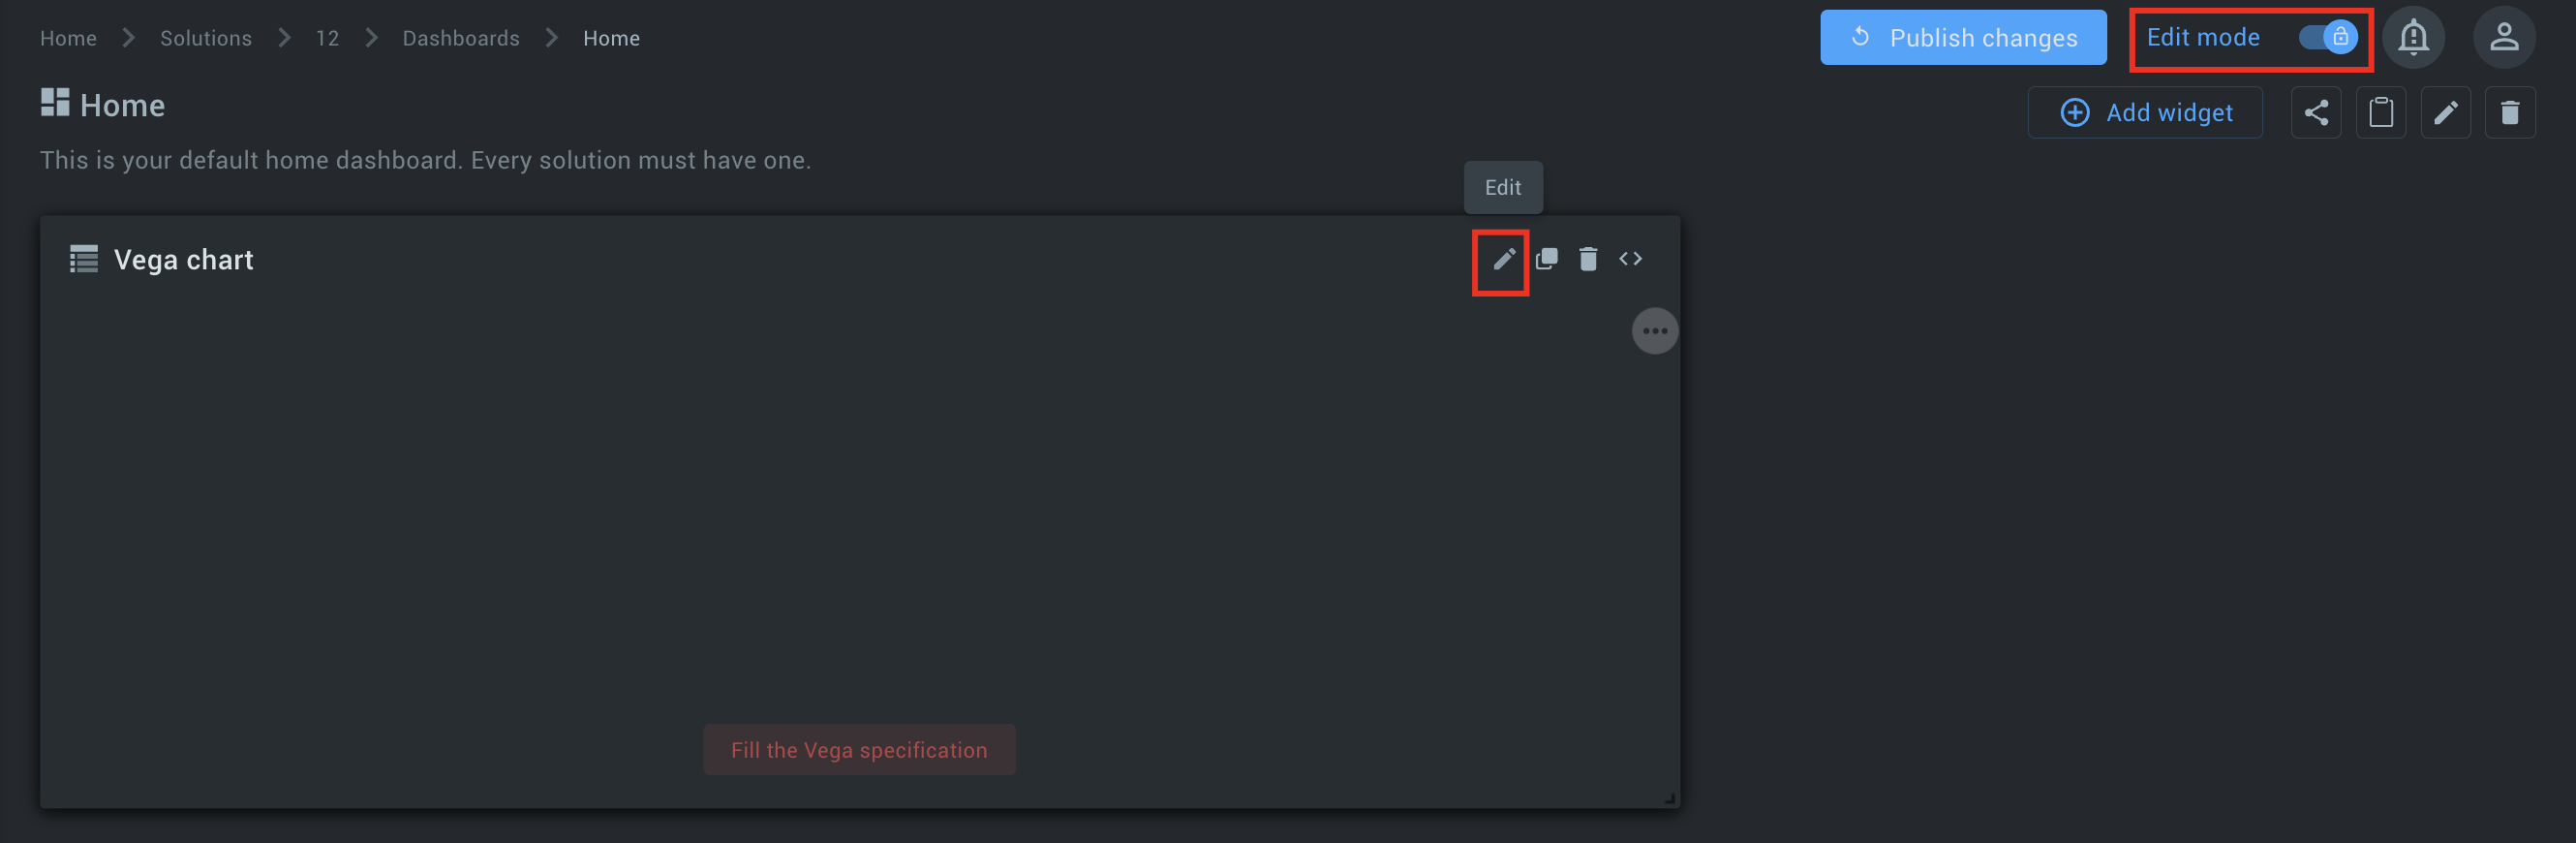
- Click on the Add widget button, select the Time series widget group, and add the Vega Chart widget.
- After you have added the Vega Chart widget, click the Edit button in the upper right corner of this widget. Note: make sure that the Edit mode switch in the upper right corner of the screen is activated.
- In the edit screen of the widget, we are interested in the text field called Vega specification, located at the end of the list on the right side of the configuration window. In this text box, we need to paste our customized code for the Vega Editor.
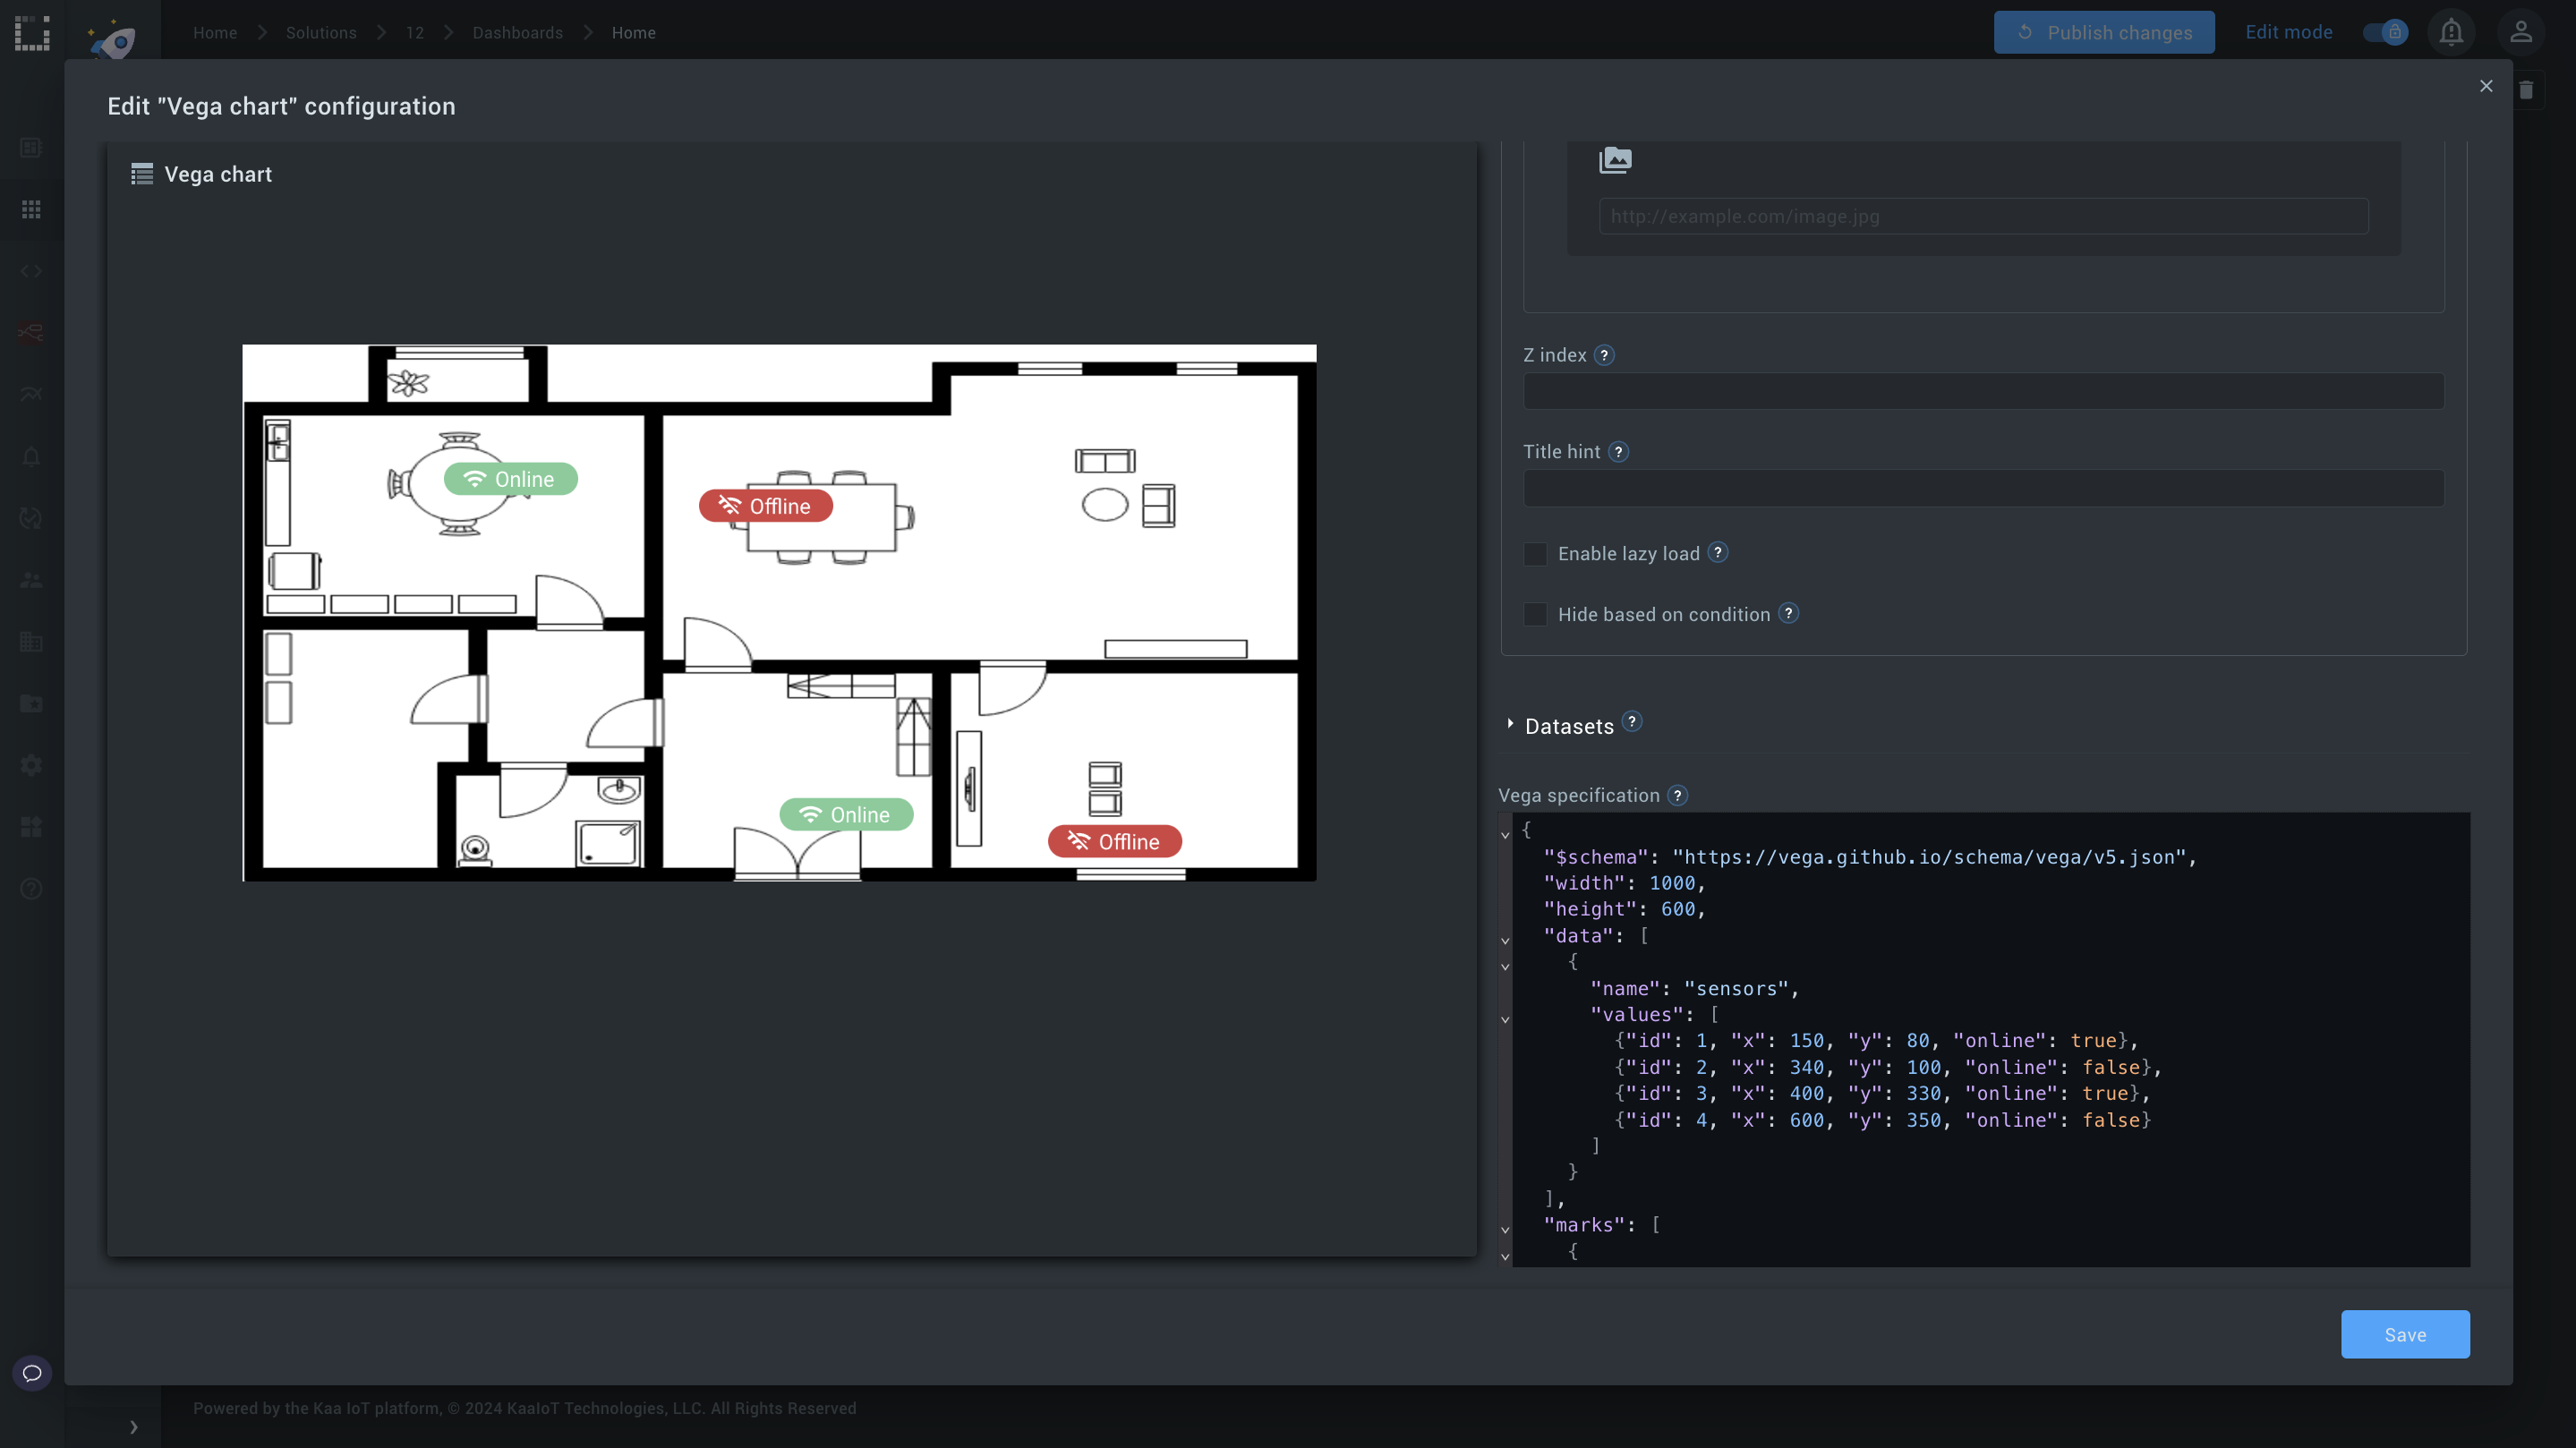
- The Vega definition example used in this tutorial can be downloaded here.
After you have inserted this code, you should ensure that the Vega widget is displayed correctly.
Please note that the widget is deployed with dimensions of 1000 by 600. This parameter, in turn, is responsible for the next part of the code:
"width": 1000,
"height": 600,
If we remove this part of the code, then the widget will be placed exactly in the middle, so when you are in the dashboard tab (in our case, it is the dashboard called "Home"), change the size and proportions of the widget so that the image of the apartment plan is displayed correctly.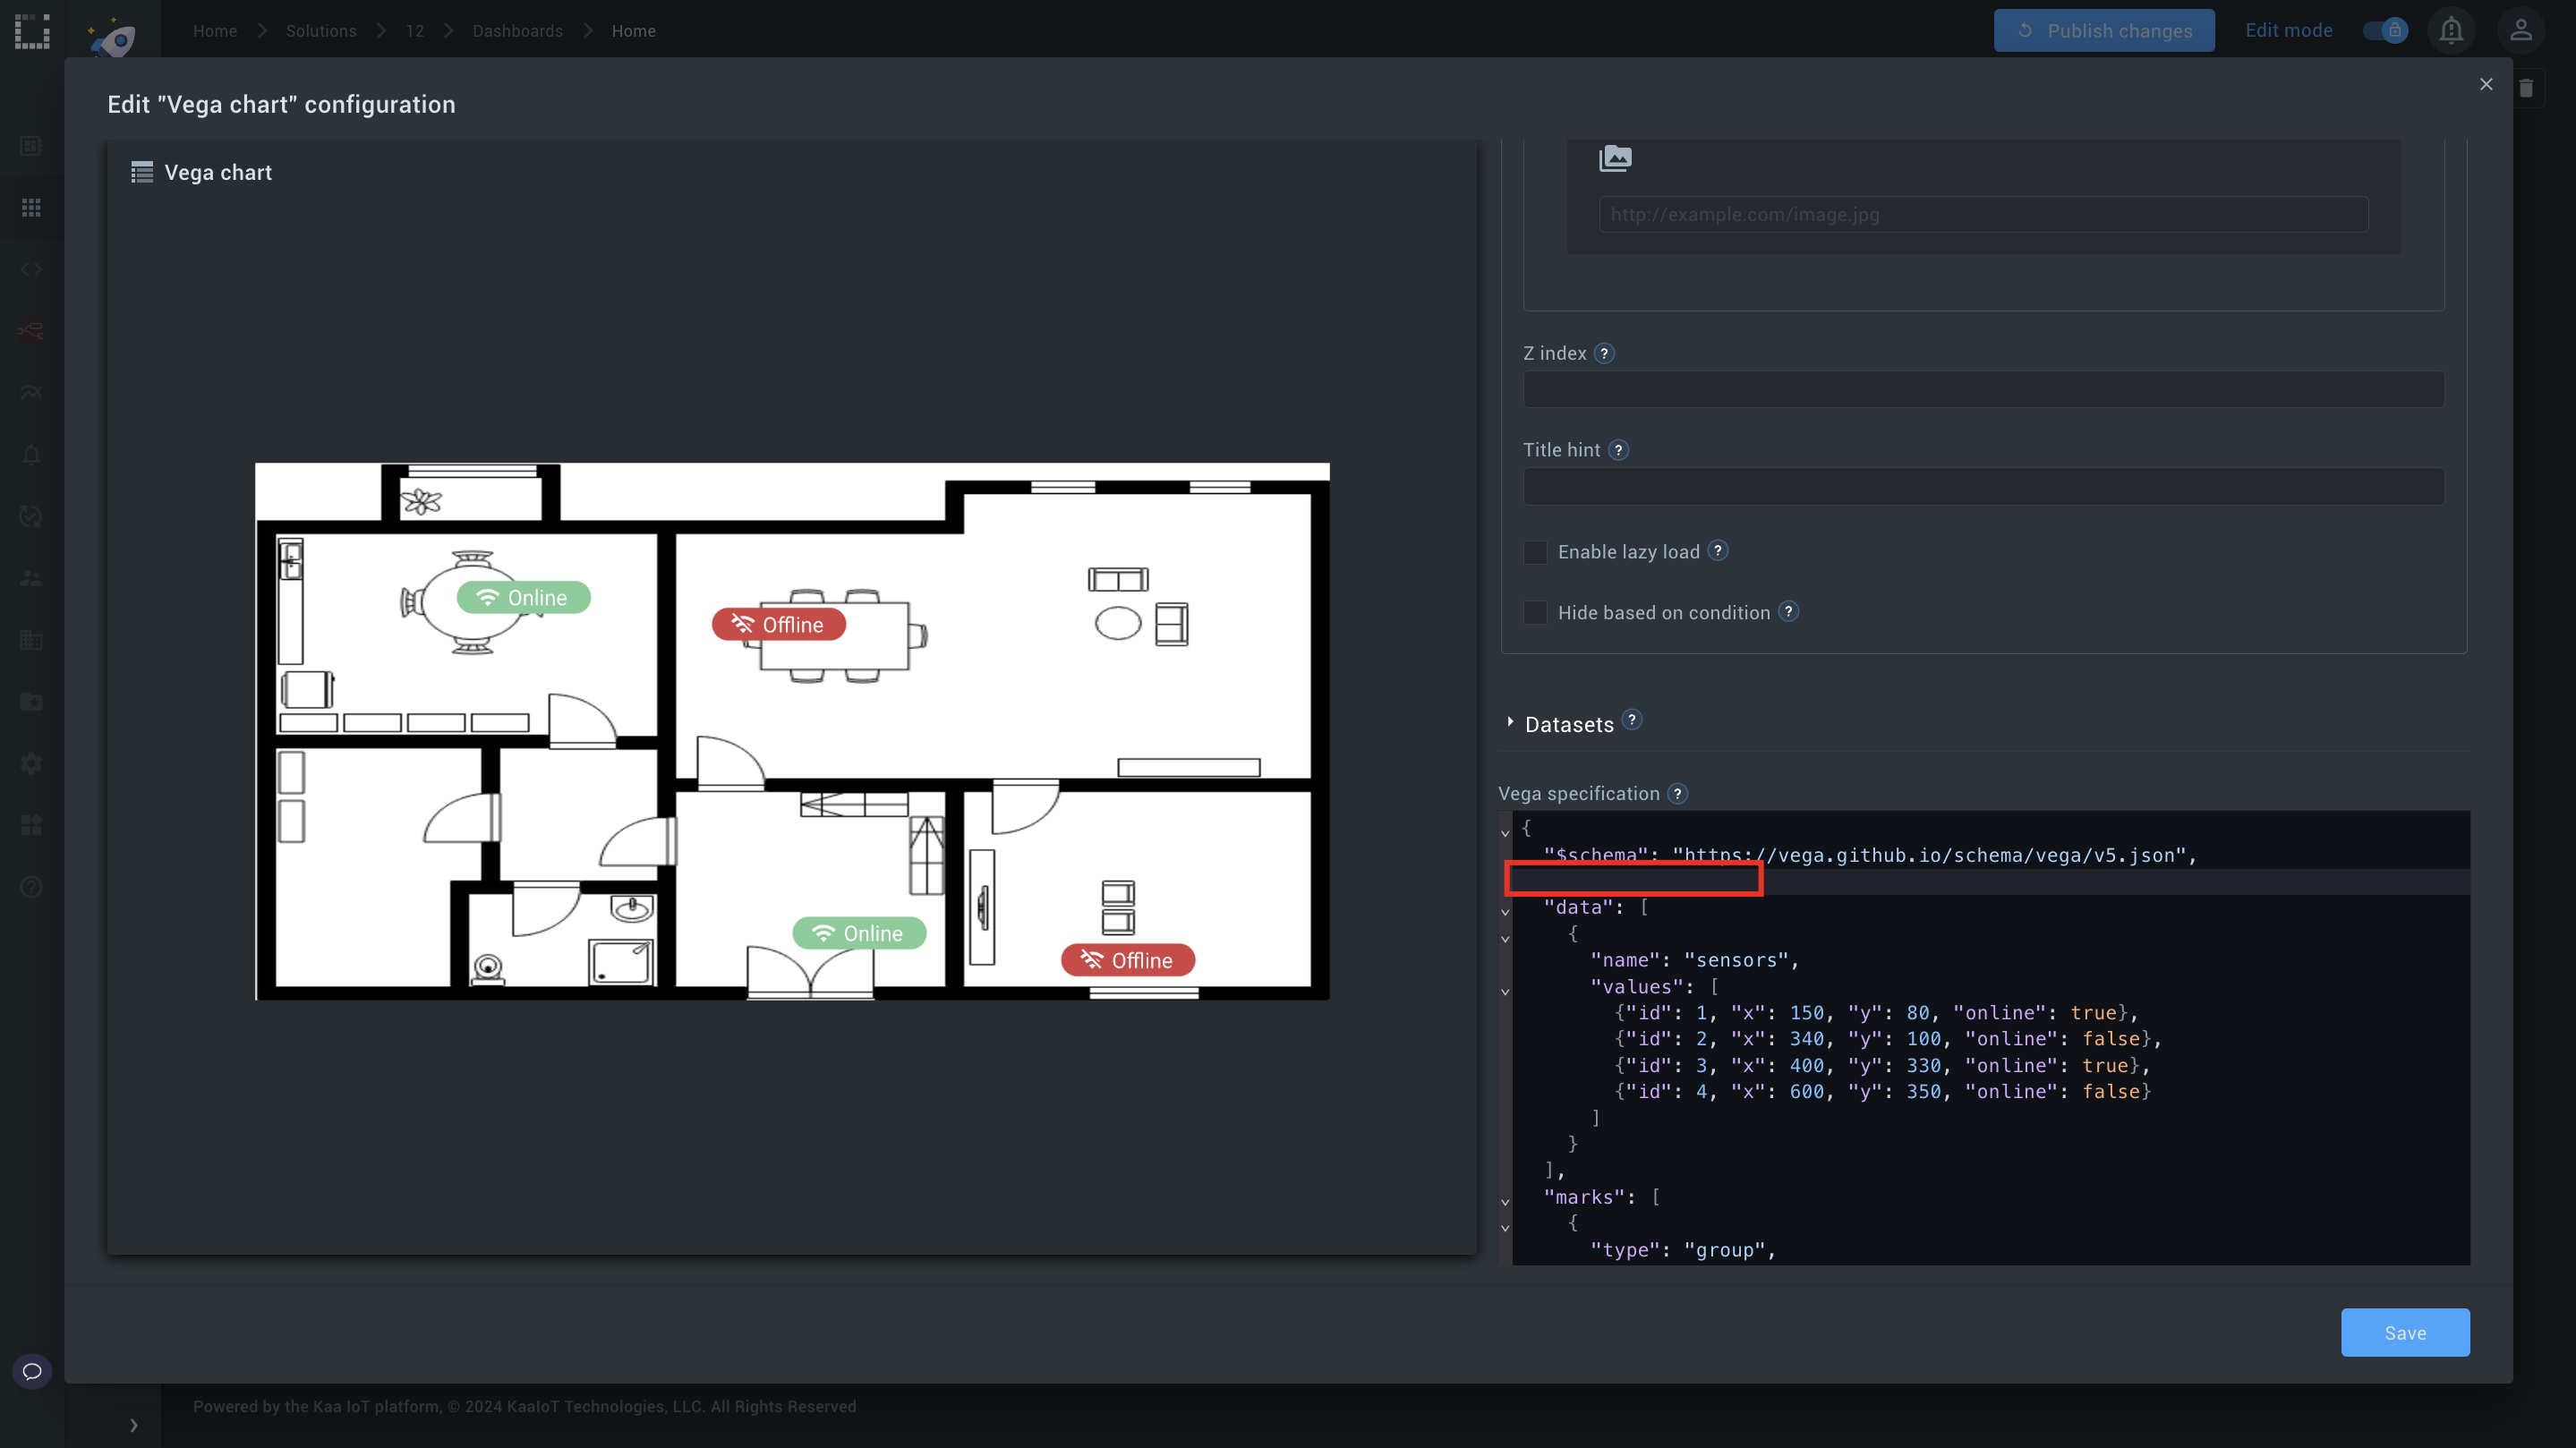
- Click Save
#3. Linking an apartment plan image to the Vega Chart widget
Now, let's figure out where we got the house/apartment plan image from. This code snippet is responsible for the file containing the apartment plan:
"url": {"value": "https://minio.cloud.kaaiot.com/d6312fc1-4c5d-4d1d-8c8c-8ab16435b560-public/vega-graphics-tutorial/floor-plan-1.png"},
In order to save your apartment plan for future use, you need to do as follows:
- From the Kaa Cloud home page, go to the Files tab, and then you will be switched to the MinIO Browser section, where you will have access to the Buckets list. For the presentation, we will use the bucket with the following address:
93b0a1d1-5963-4ecb-87b2-11f75308847a-public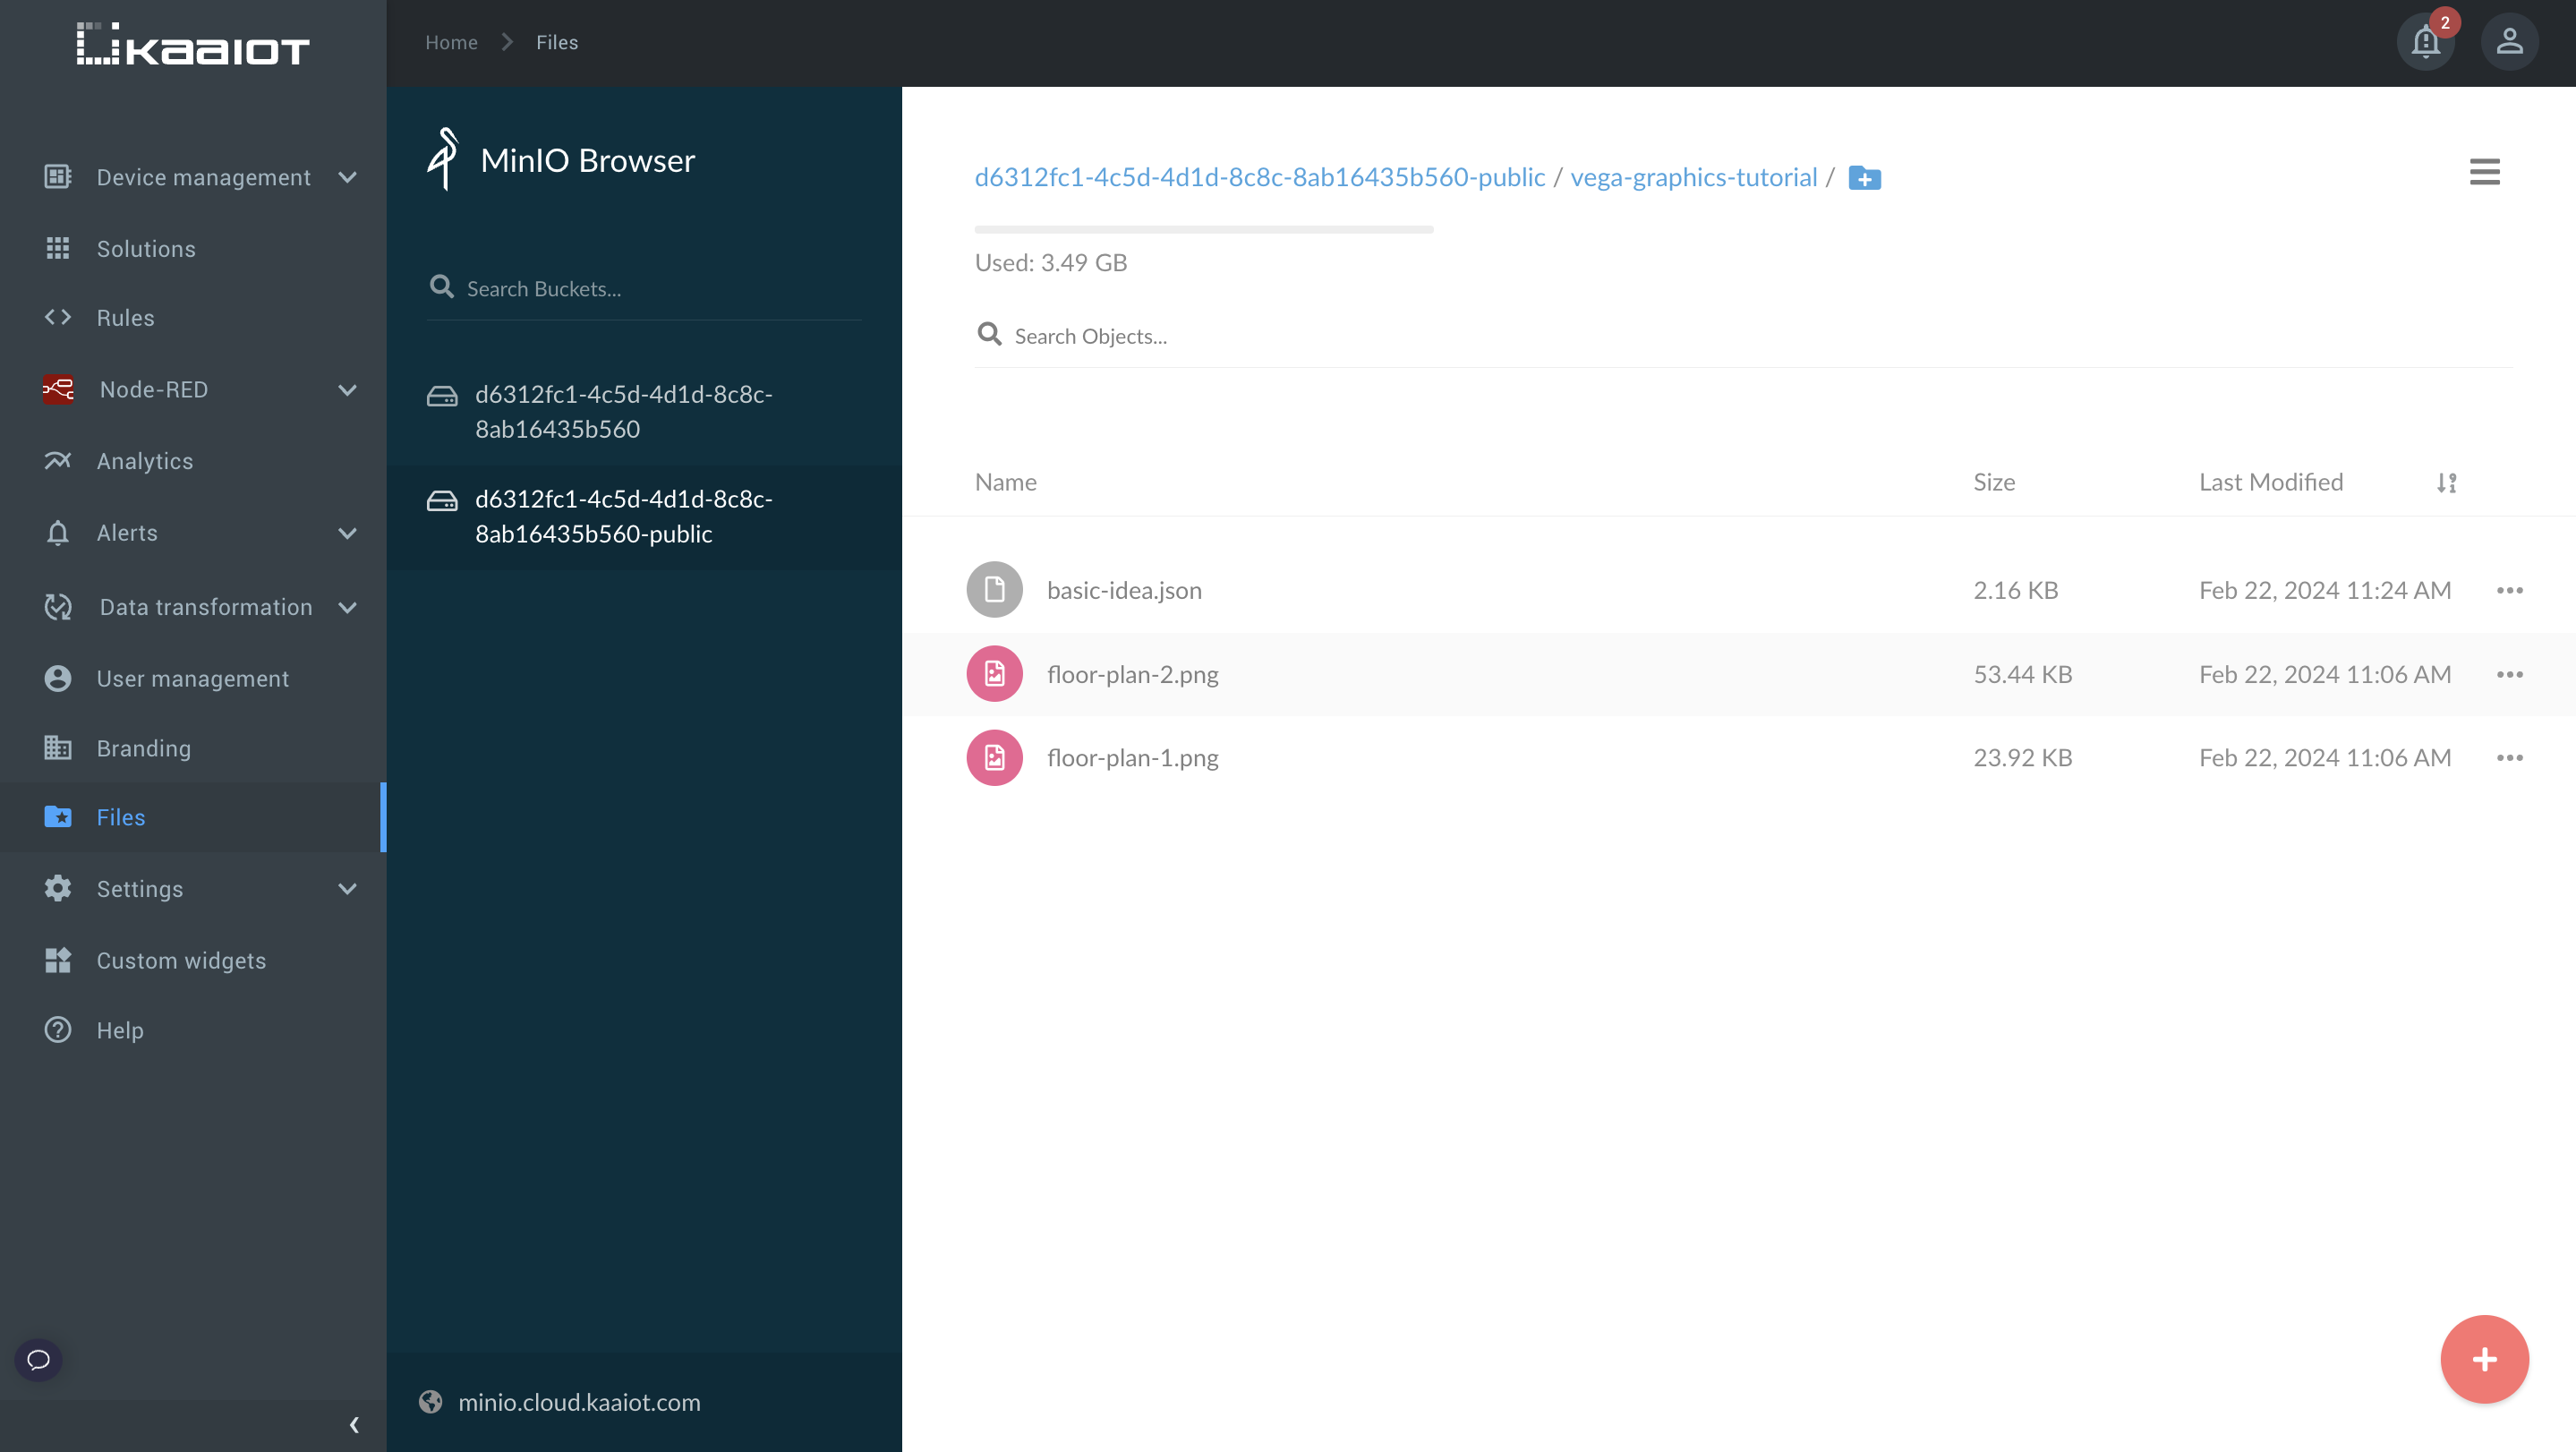
- From the list of buckets in the Files tab, you need a bucket with the "public" prefix in the address, and this is an important point for the success of the operation.
- After selecting the correct bucket, find the “+ ”button in the lower right corner and click on it. From the 2 options, select the cloud icon called Upload file.
- After clicking on the Upload file button, you will see a pop-up window of the file explorer, in which you already need to find the folder with the apartment plan file you need and select the apartment file itself. In our case, this is a file called "floor-plan-1.png".
- If you did everything correctly, you should see your file on the Kaa Cloud website in the Files tab in the public bucket.
The next step is to get a link to the file with the apartment plan and add it to our code. After completing this step, you will learn how to add your custom floor plan to the Vega Chart widget.
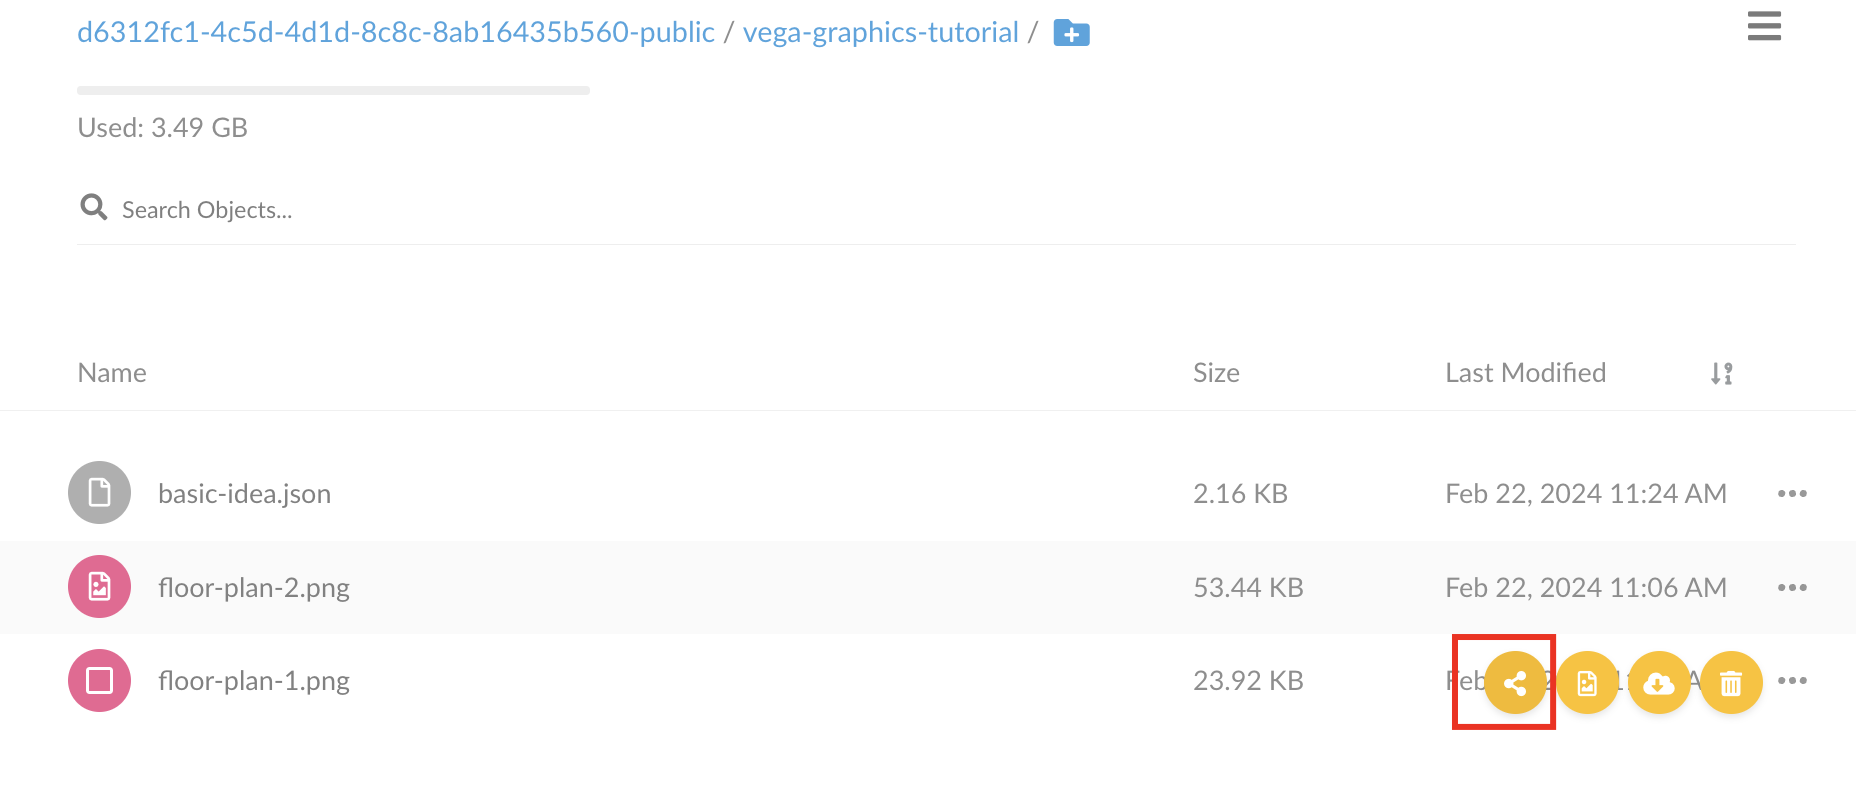
- First, go back to the Files section and find the file you need (in our case, it's "floor-plan-1.png").
- Opposite our file, find the Ellipsis button and click on it.
- We now have 4 options. We need the first one - the Share button.
- We see a pop-up window called Share Object where we should copy the link.
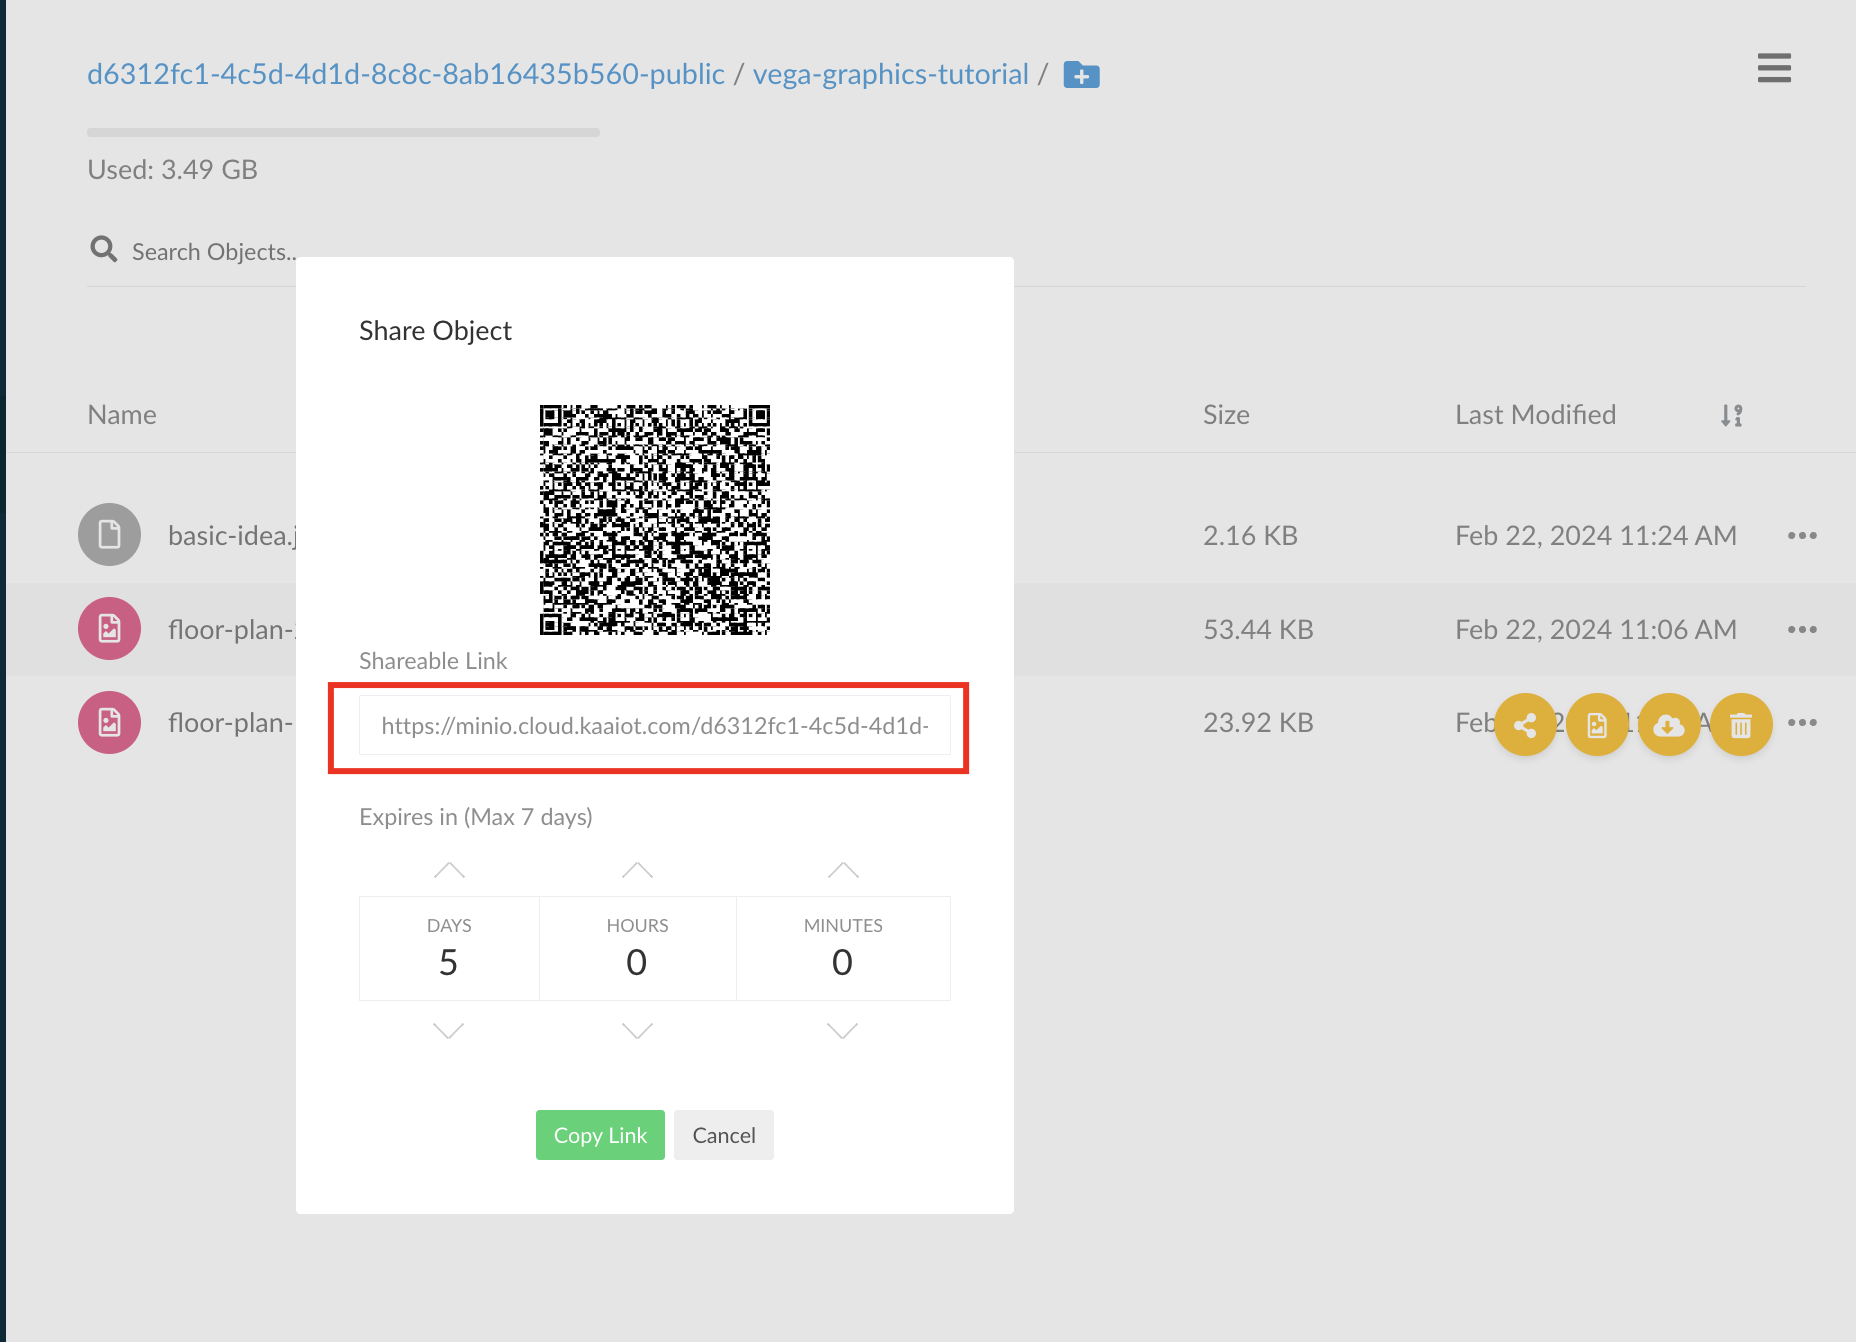
- We get the URL to our file with the floor plan. In our case, this link looks like this:
This link contains additional parameters that we don't need, which is why we'll extract only the link to our file from the whole link without any additional parameters. Then our link will look like this:
https://minio.cloud.kaaiot.com/93b0a1d1-5963-4ecb-87b2-11f75308847a-public/floor-plan-1.png
#4. Binding sensors to the Vega Chart widget
We've shown you how to set up and operate the Vega Chart widget, but, as you may have noticed, the data it provides is static. This is because our widget is not connected to the sensors and does not receive actual data in real-time. To configure this, we need to:
- Navigate to our widget (select the correct dashboard via the Solution tab and find our Vega Chart widget). Click the Edit button (make sure you are in Edit mode).
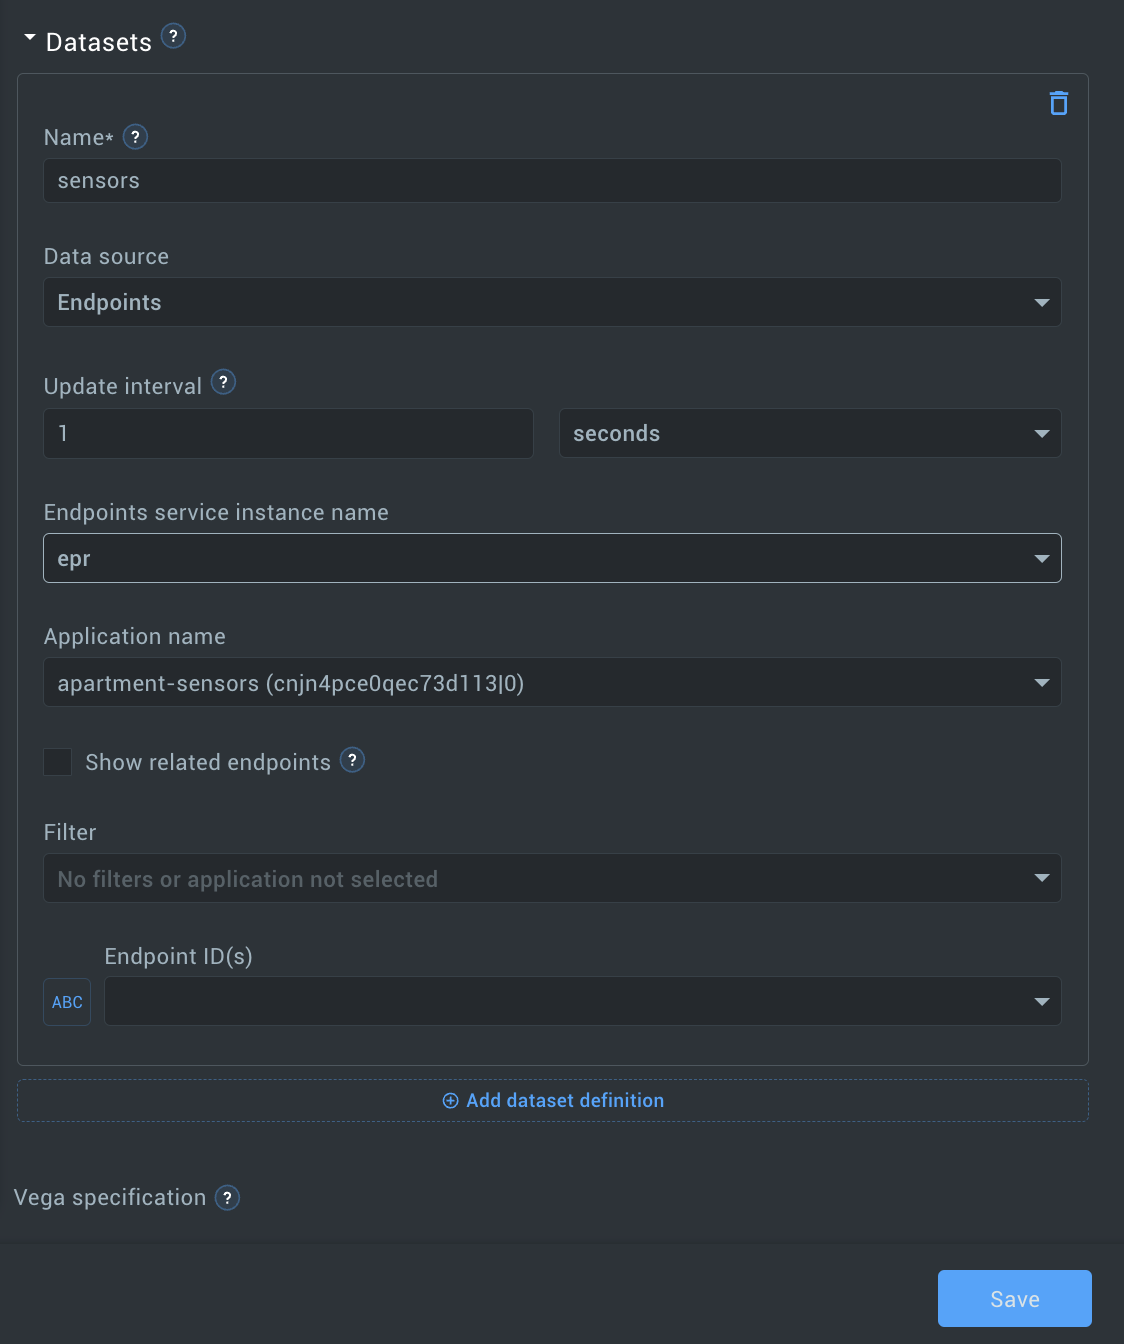
- In the Edit "Vega chart" configuration window, we are interested in the Datasets section, which is where we will configure the data updating. First, click on the Datasets, and then on the button that appears called Add dataset definition.
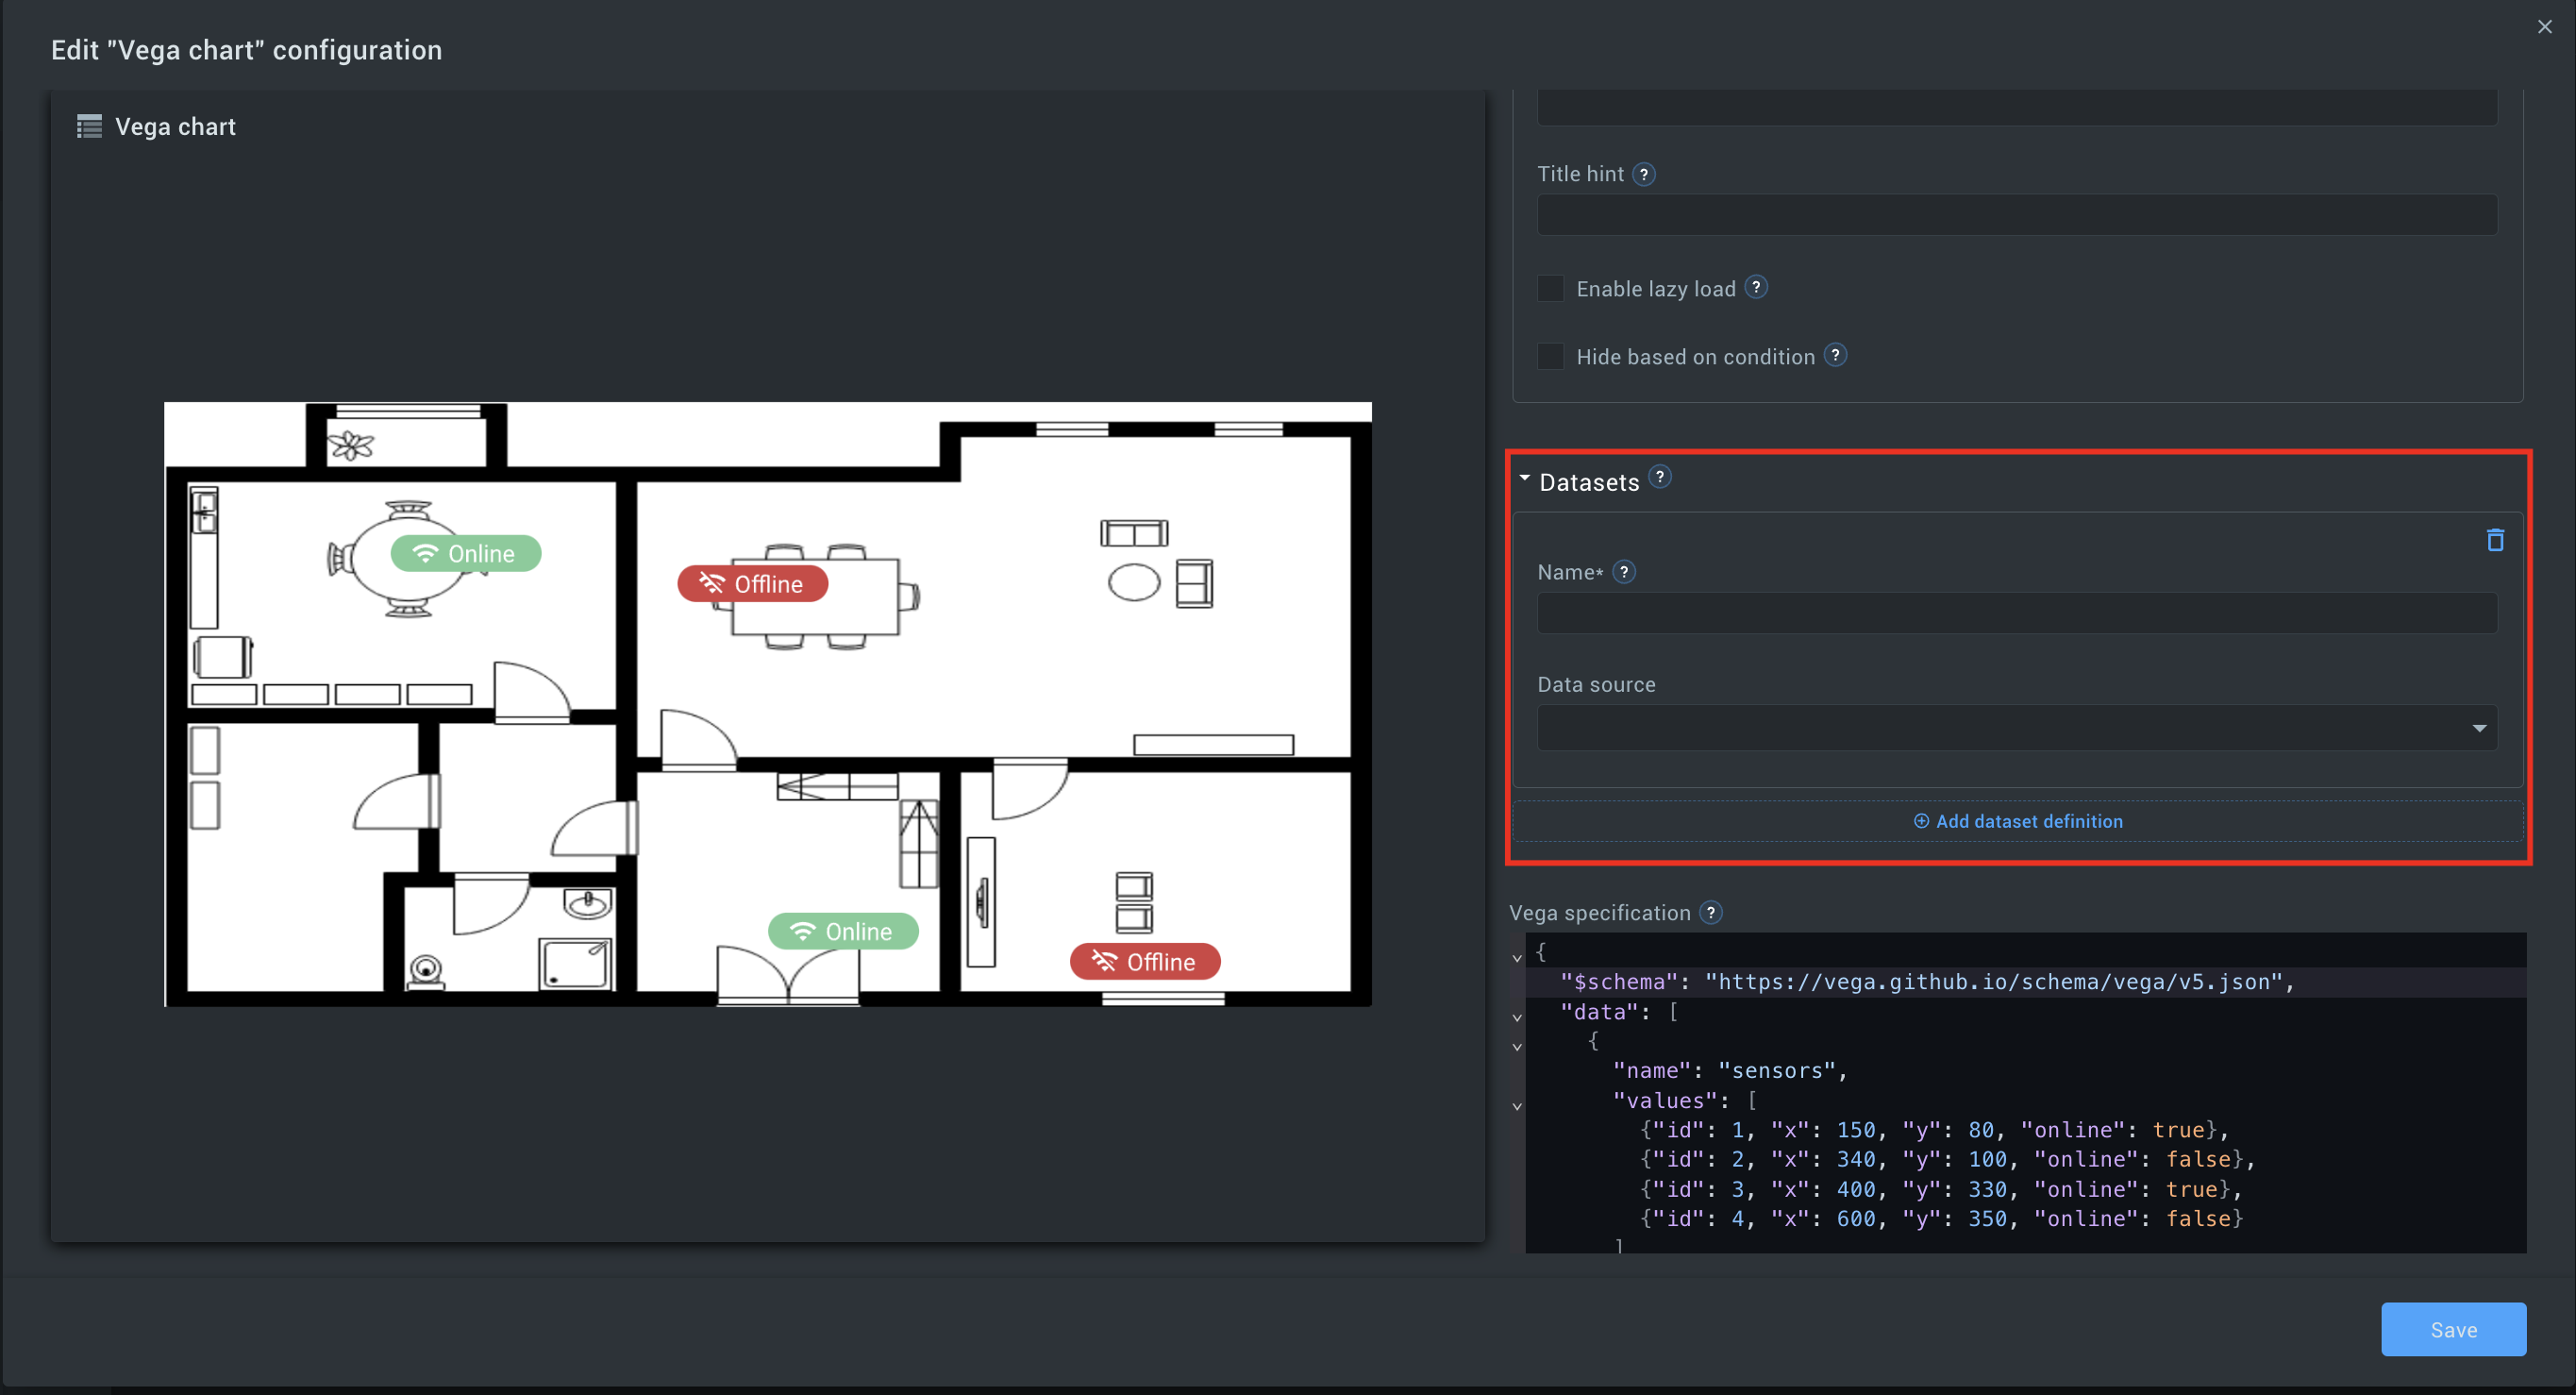
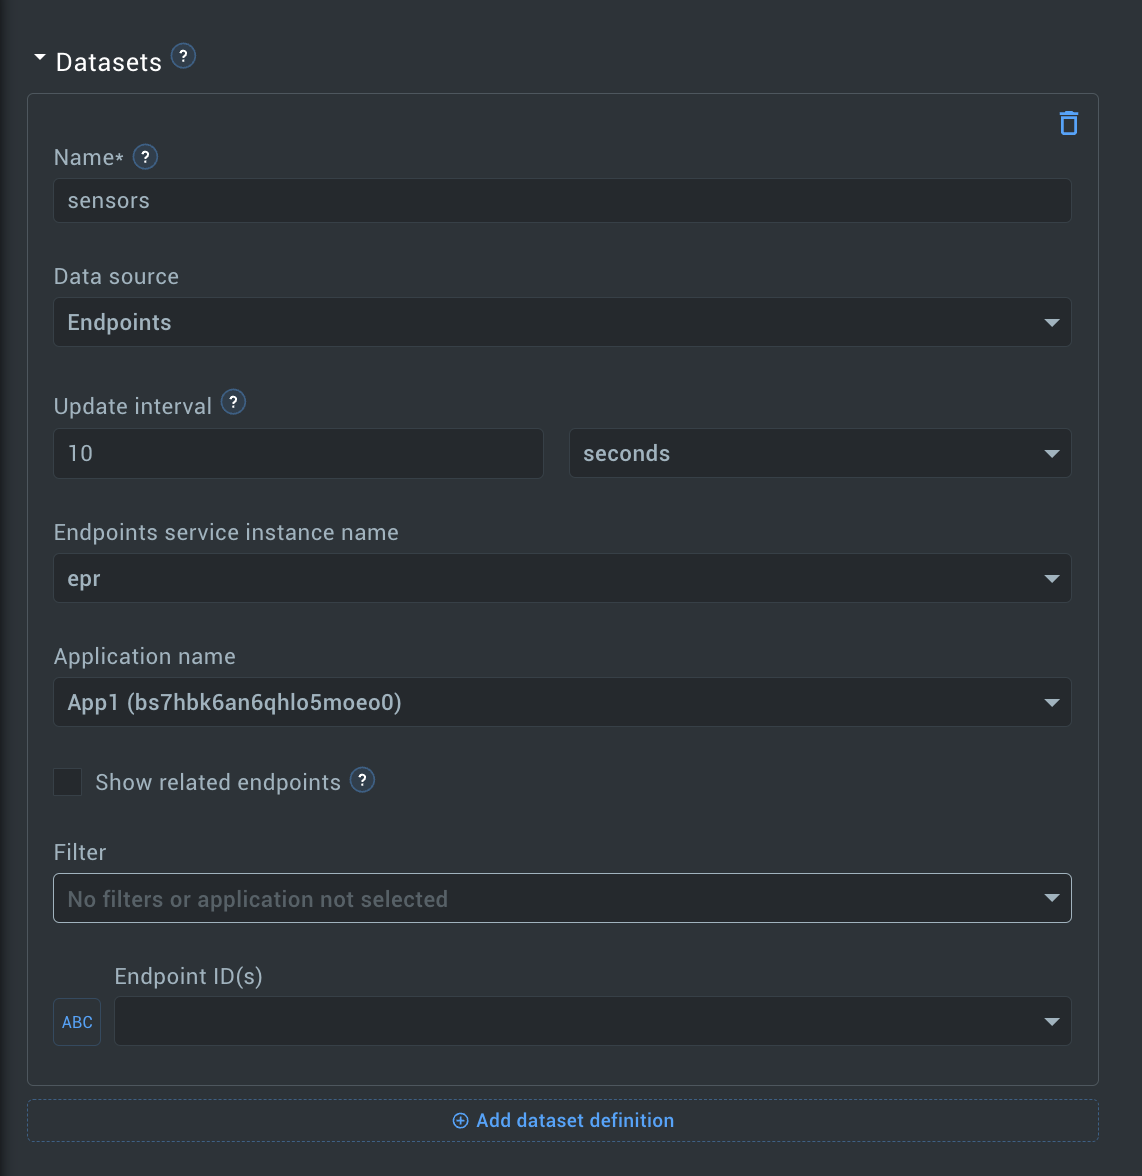
- At this point, we need to name our dataset, which is responsible for updating the data from the sensors. We will name our dataset "sensors", according to the name that is written in the Vega Chart widget configuration.
- The next step in the Data source drop-down menu is to select the Endpoints option. To select the data source and endpoints, we need to select your Application.
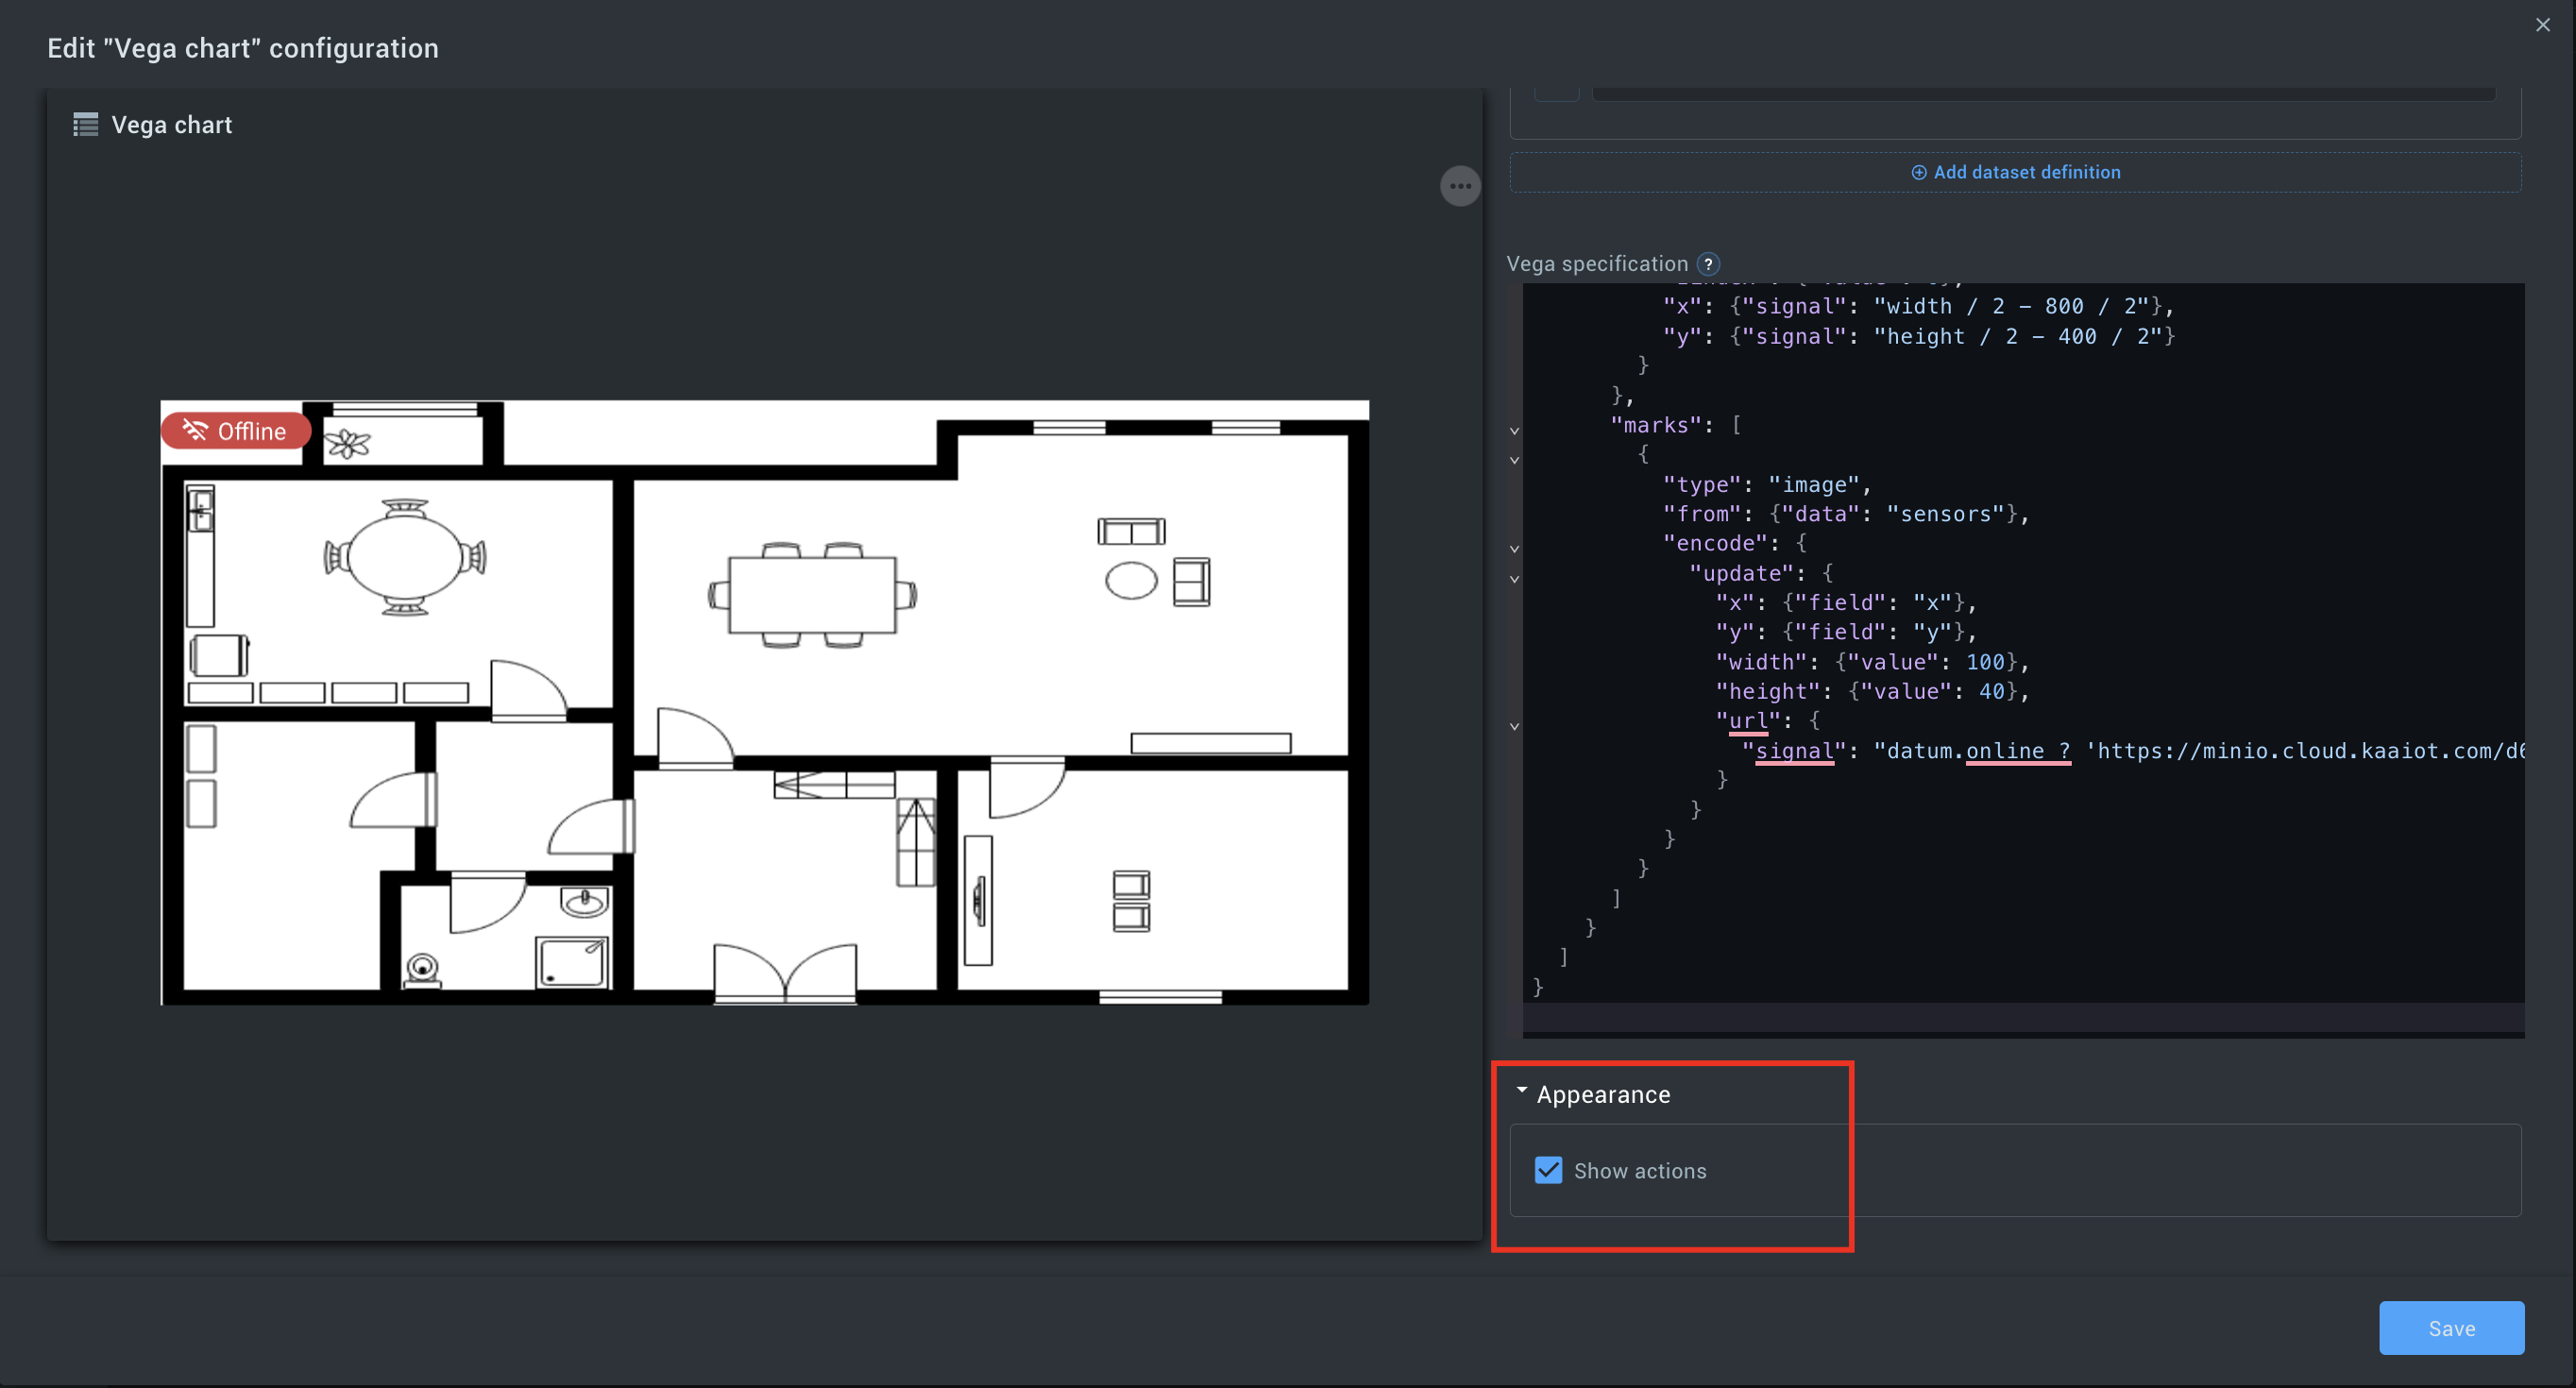
- After we have added the source to the widget from which it will receive information about the status of the widgets, we need to remove the parameters for overlaying the sensor icons that we used for the presentation from the widget code. To do this, you need to find this segment in the widget code:
"data": [ { "name": "sensors", "values": [ {"id": 1, "x": 150, "y": 80, "online": true}, {"id": 2, "x": 340, "y": 100, "online": false}, {"id": 3, "x": 400, "y": 330, "online": true}, {"id": 4, "x": 600, "y": 350, "online": false} ] } ], - After we removed this part of the code, our widget started displaying again, and in general, the code for our widget now looks like this:
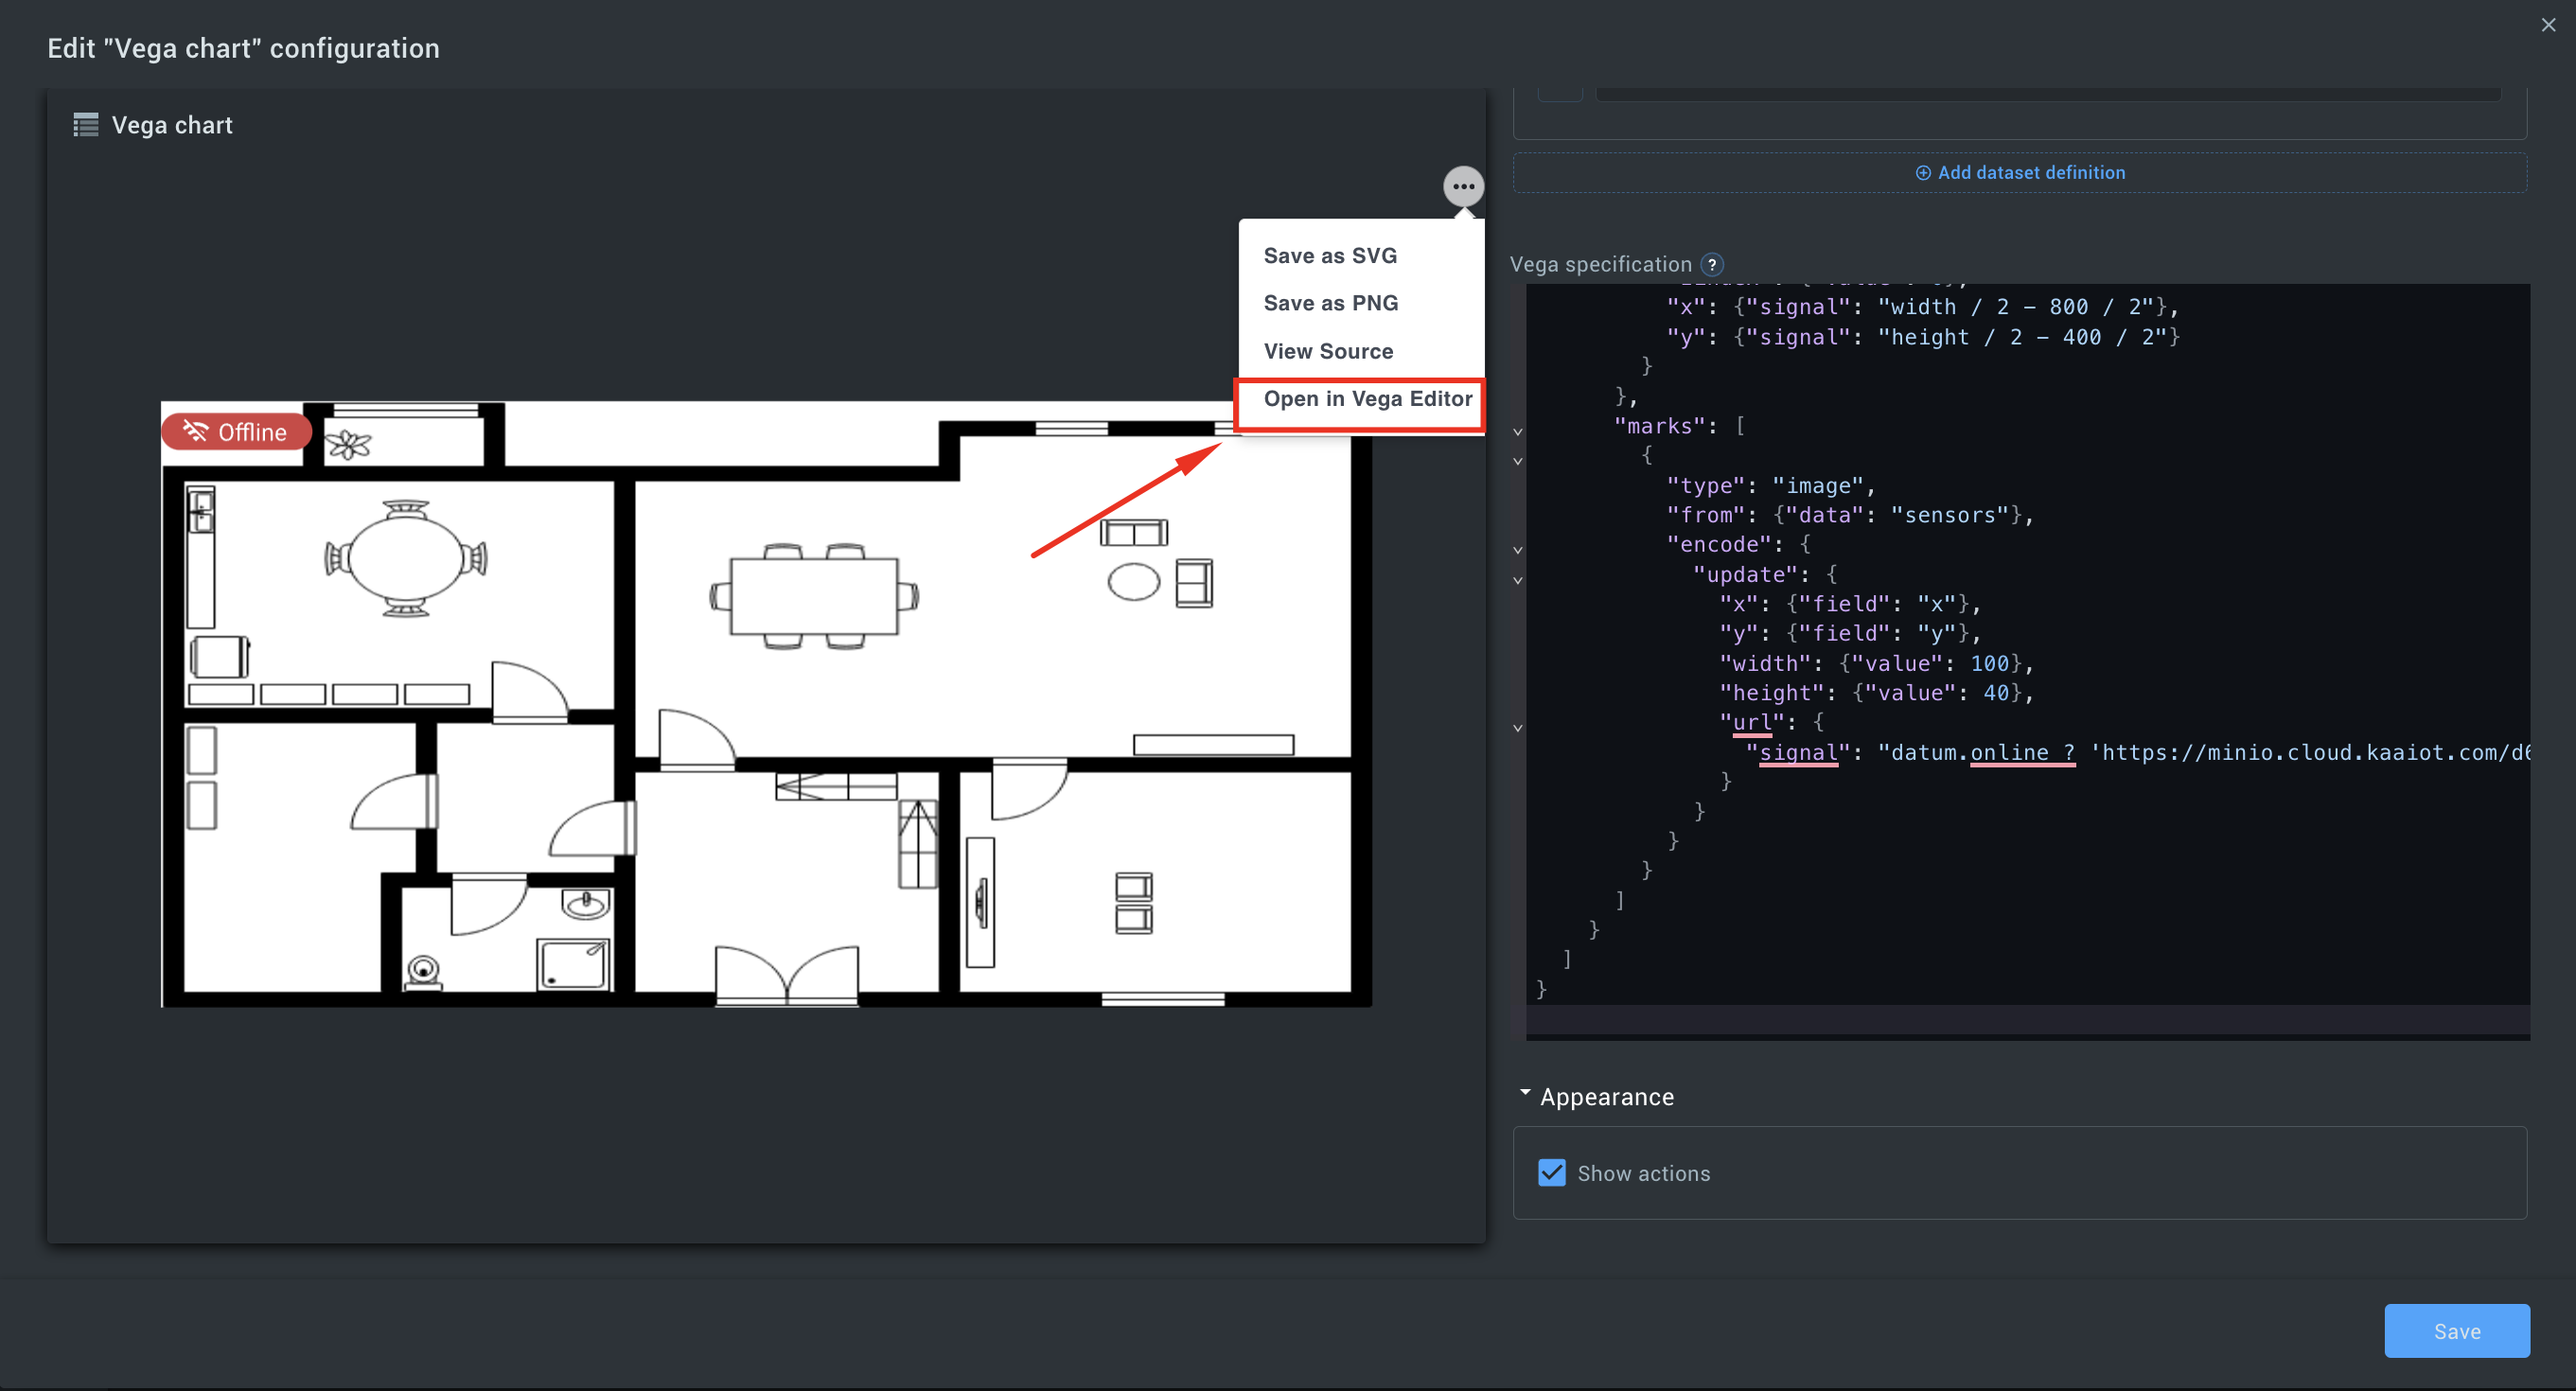
{ "$schema": "https://vega.github.io/schema/vega/v5.json", "marks": [ { "type": "group", "encode": { "update": { "width": {"value": 800}, "height": {"value": 400}, "zindex": {"value": 0}, "x": {"signal": "width / 2 - 800 / 2"}, "y": {"signal": "height / 2 - 400 / 2"} } }, "marks": [ { "type": "image", "encode": { "enter": { "url": {"value": "https://minio.cloud.kaaiot.com/d6312fc1-4c5d-4d1d-8c8c-8ab16435b560-public/vega-graphics-tutorial/floor-plan-1.png"}, "width": {"value": 800}, "height": {"value": 400}, "fit": {"value": "fill"}, "aspect": {"value": false} } } } ] }, { "type": "group", "encode": { "update": { "width": {"value": 800}, "height": {"value": 400}, "zindex": {"value": 0}, "x": {"signal": "width / 2 - 800 / 2"}, "y": {"signal": "height / 2 - 400 / 2"} } }, "marks": [ { "type": "image", "from": {"data": "sensors"}, "encode": { "update": { "x": {"field": "x"}, "y": {"field": "y"}, "width": {"value": 100}, "height": {"value": 40}, "url": { "signal": "datum.online ? 'https://minio.cloud.kaaiot.com/d6312fc1-4c5d-4d1d-8c8c-8ab16435b560-public/__wd_resources/5f10ea03-ab2a-40da-ae97-c0a02763bfb1.svg' : 'https://minio.cloud.kaaiot.com/d6312fc1-4c5d-4d1d-8c8c-8ab16435b560-public/__wd_resources/0c1c13a9-e797-4f90-ba5d-266faef0f947.svg'" } } } } ] } ] } - The next step is to go to Appearance and check the Show actions option.
- Click on the “Edit” button and select the Open in Vega Editor option.
We are now back in the Vega Editor. As you can see, the code of our widget has been supplemented with data about each of the sensors that we display on it.
#5. Adding sensor control panels
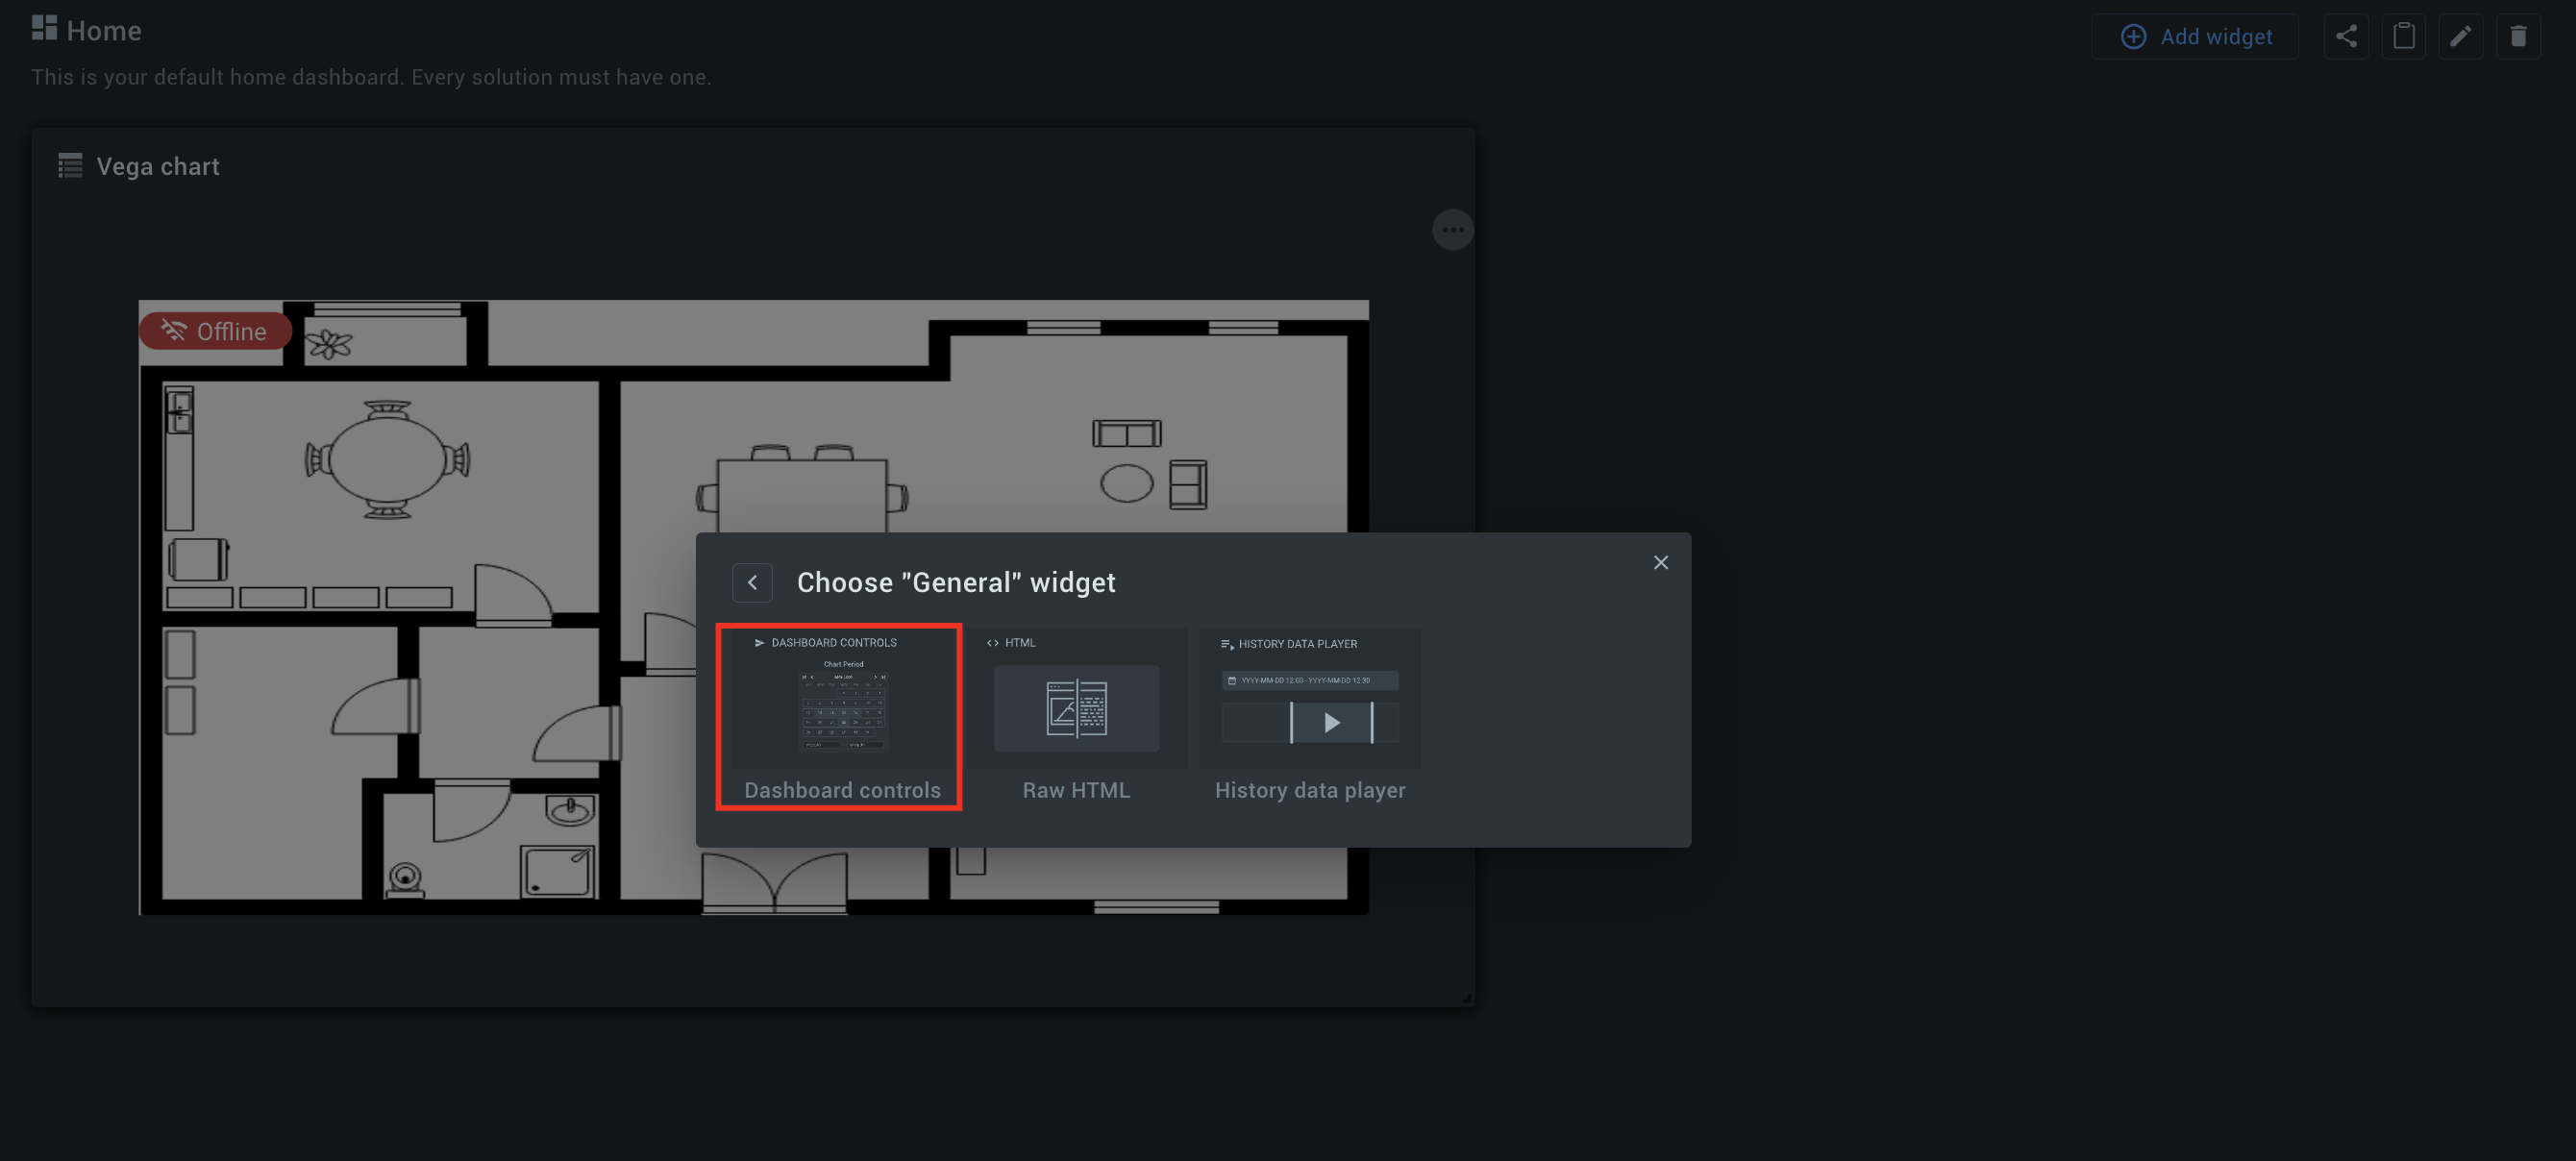
Let's return to our dashboard, where we have already placed our Vega Chart widget, and add widgets that will act as control panels for this widget. First, we need to add another widget called "Dashboards controls". To do this, you need to follow these steps:
- Go to the Dashboard.
- Click the Add widget button.
- Select the "General" section and click on the Dashboard controls widget.
Great, we've added the widget we need to our dashboard. Now, we need to customize it. To do this, you need to follow a few steps:
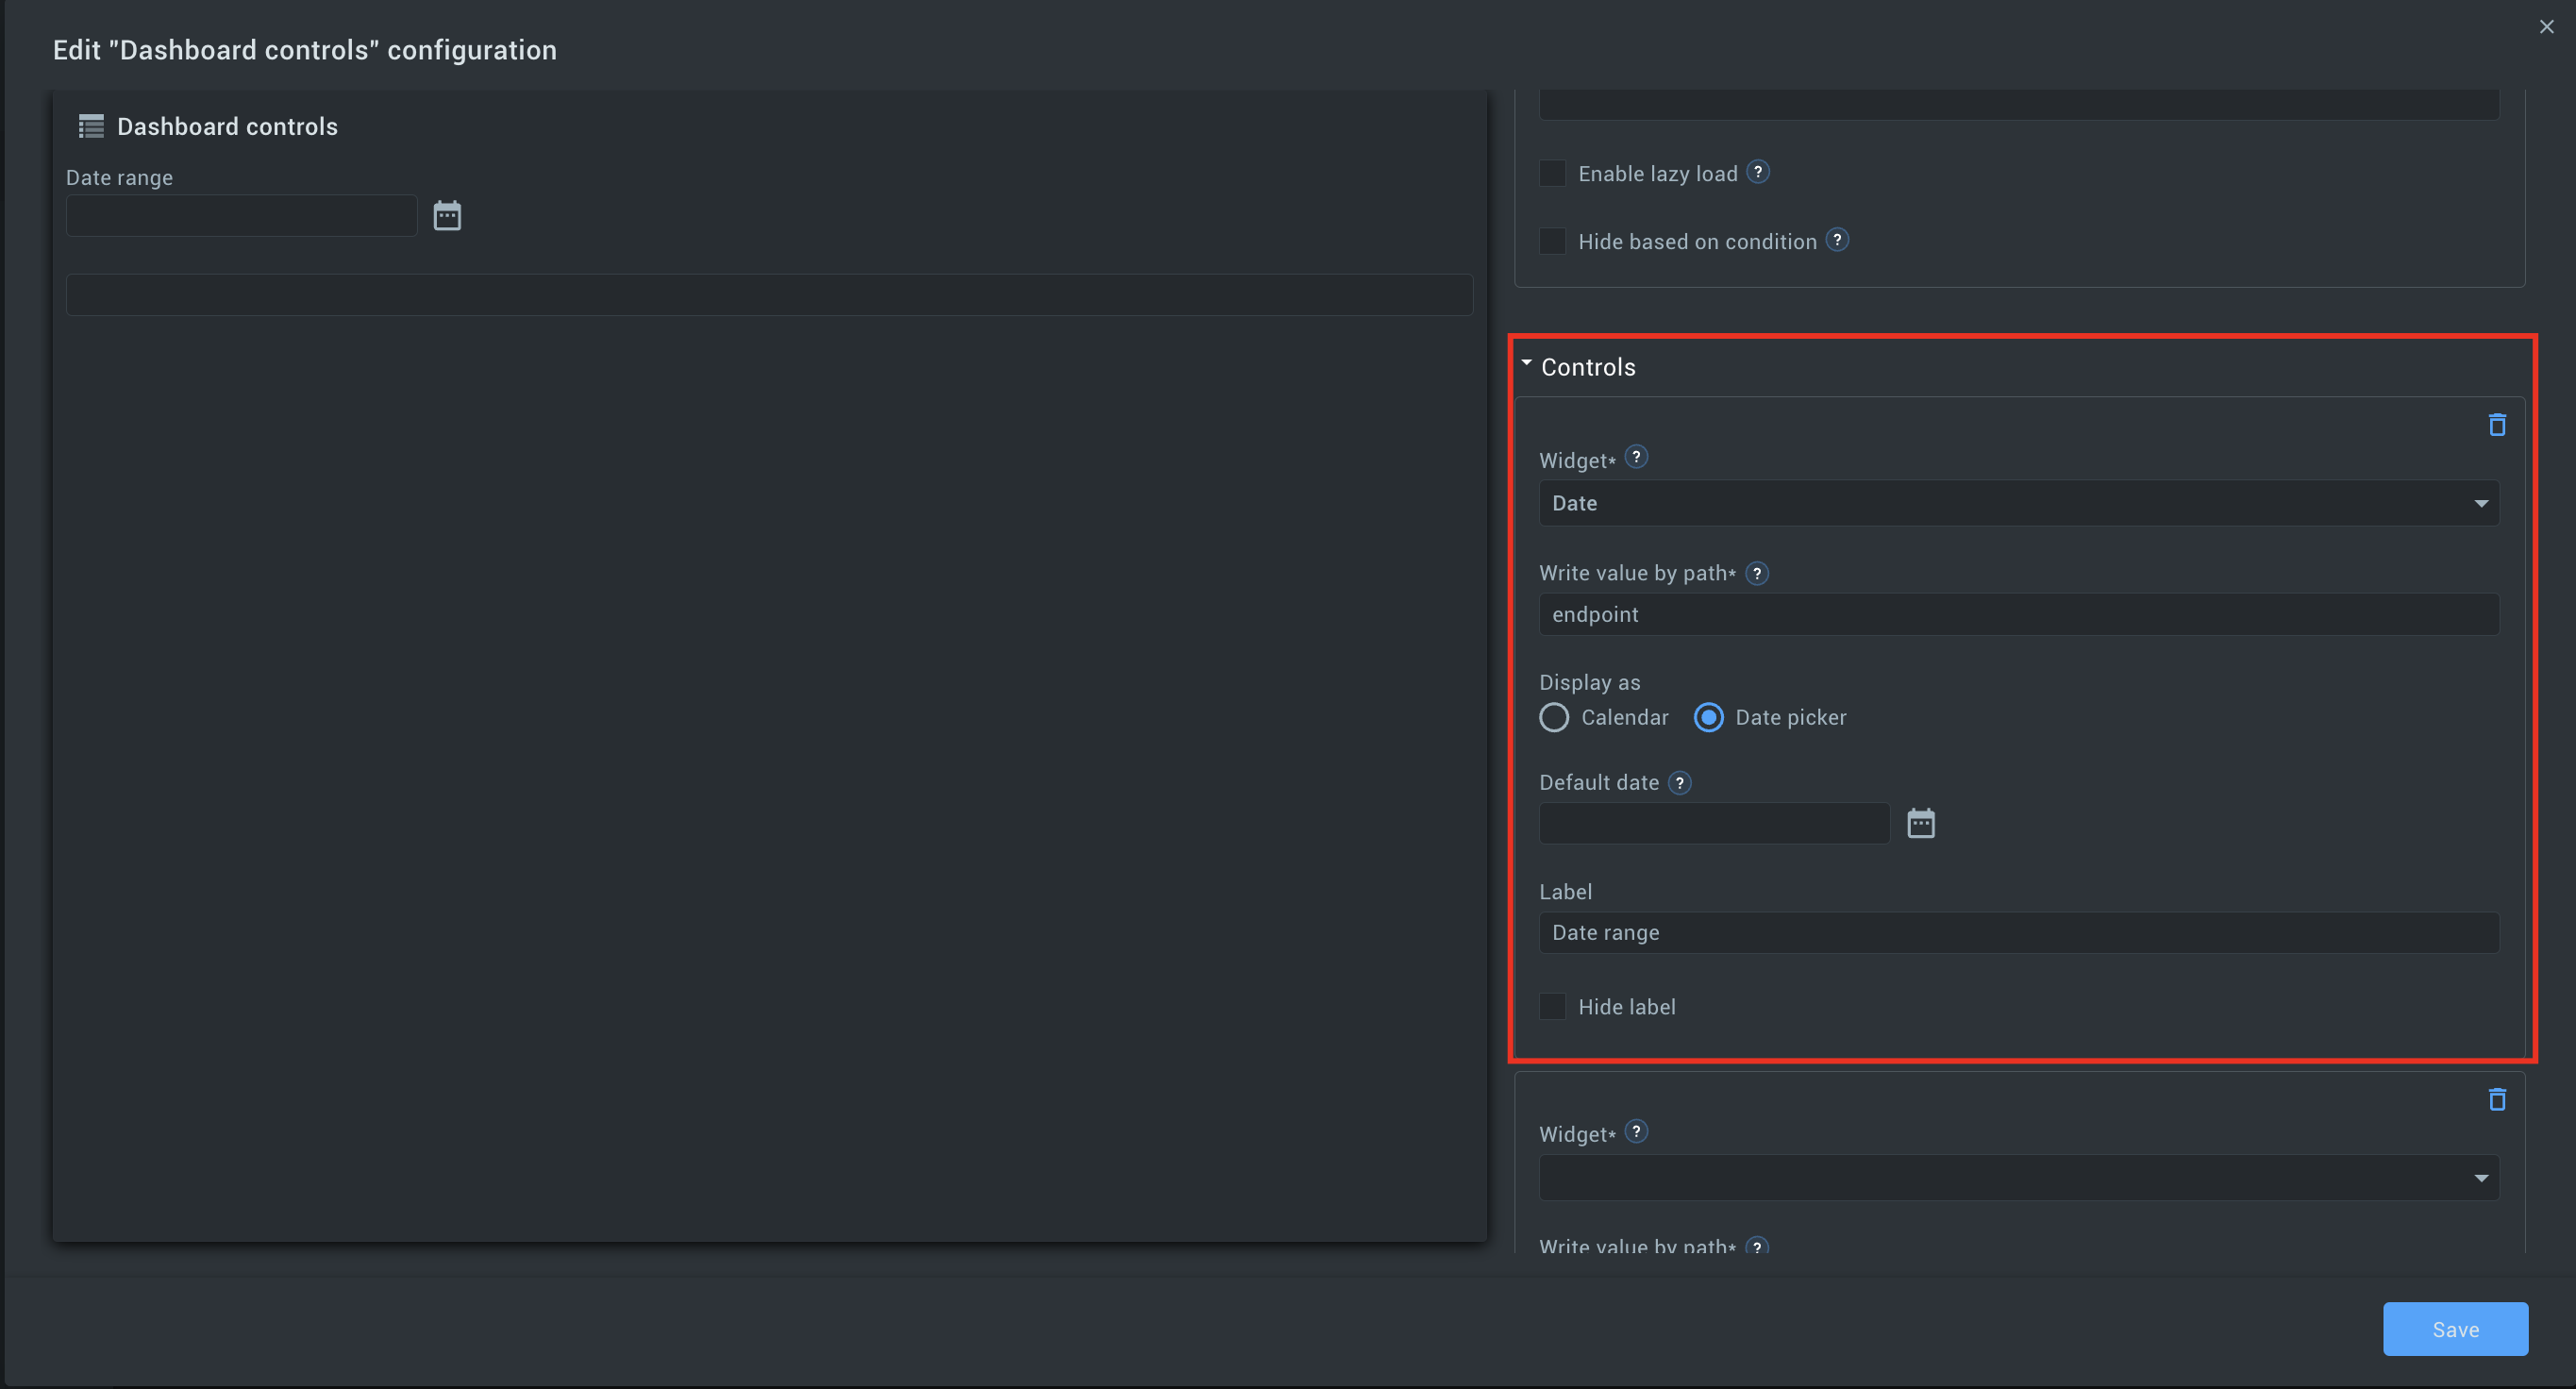
- Click on the Edit widget configuration button
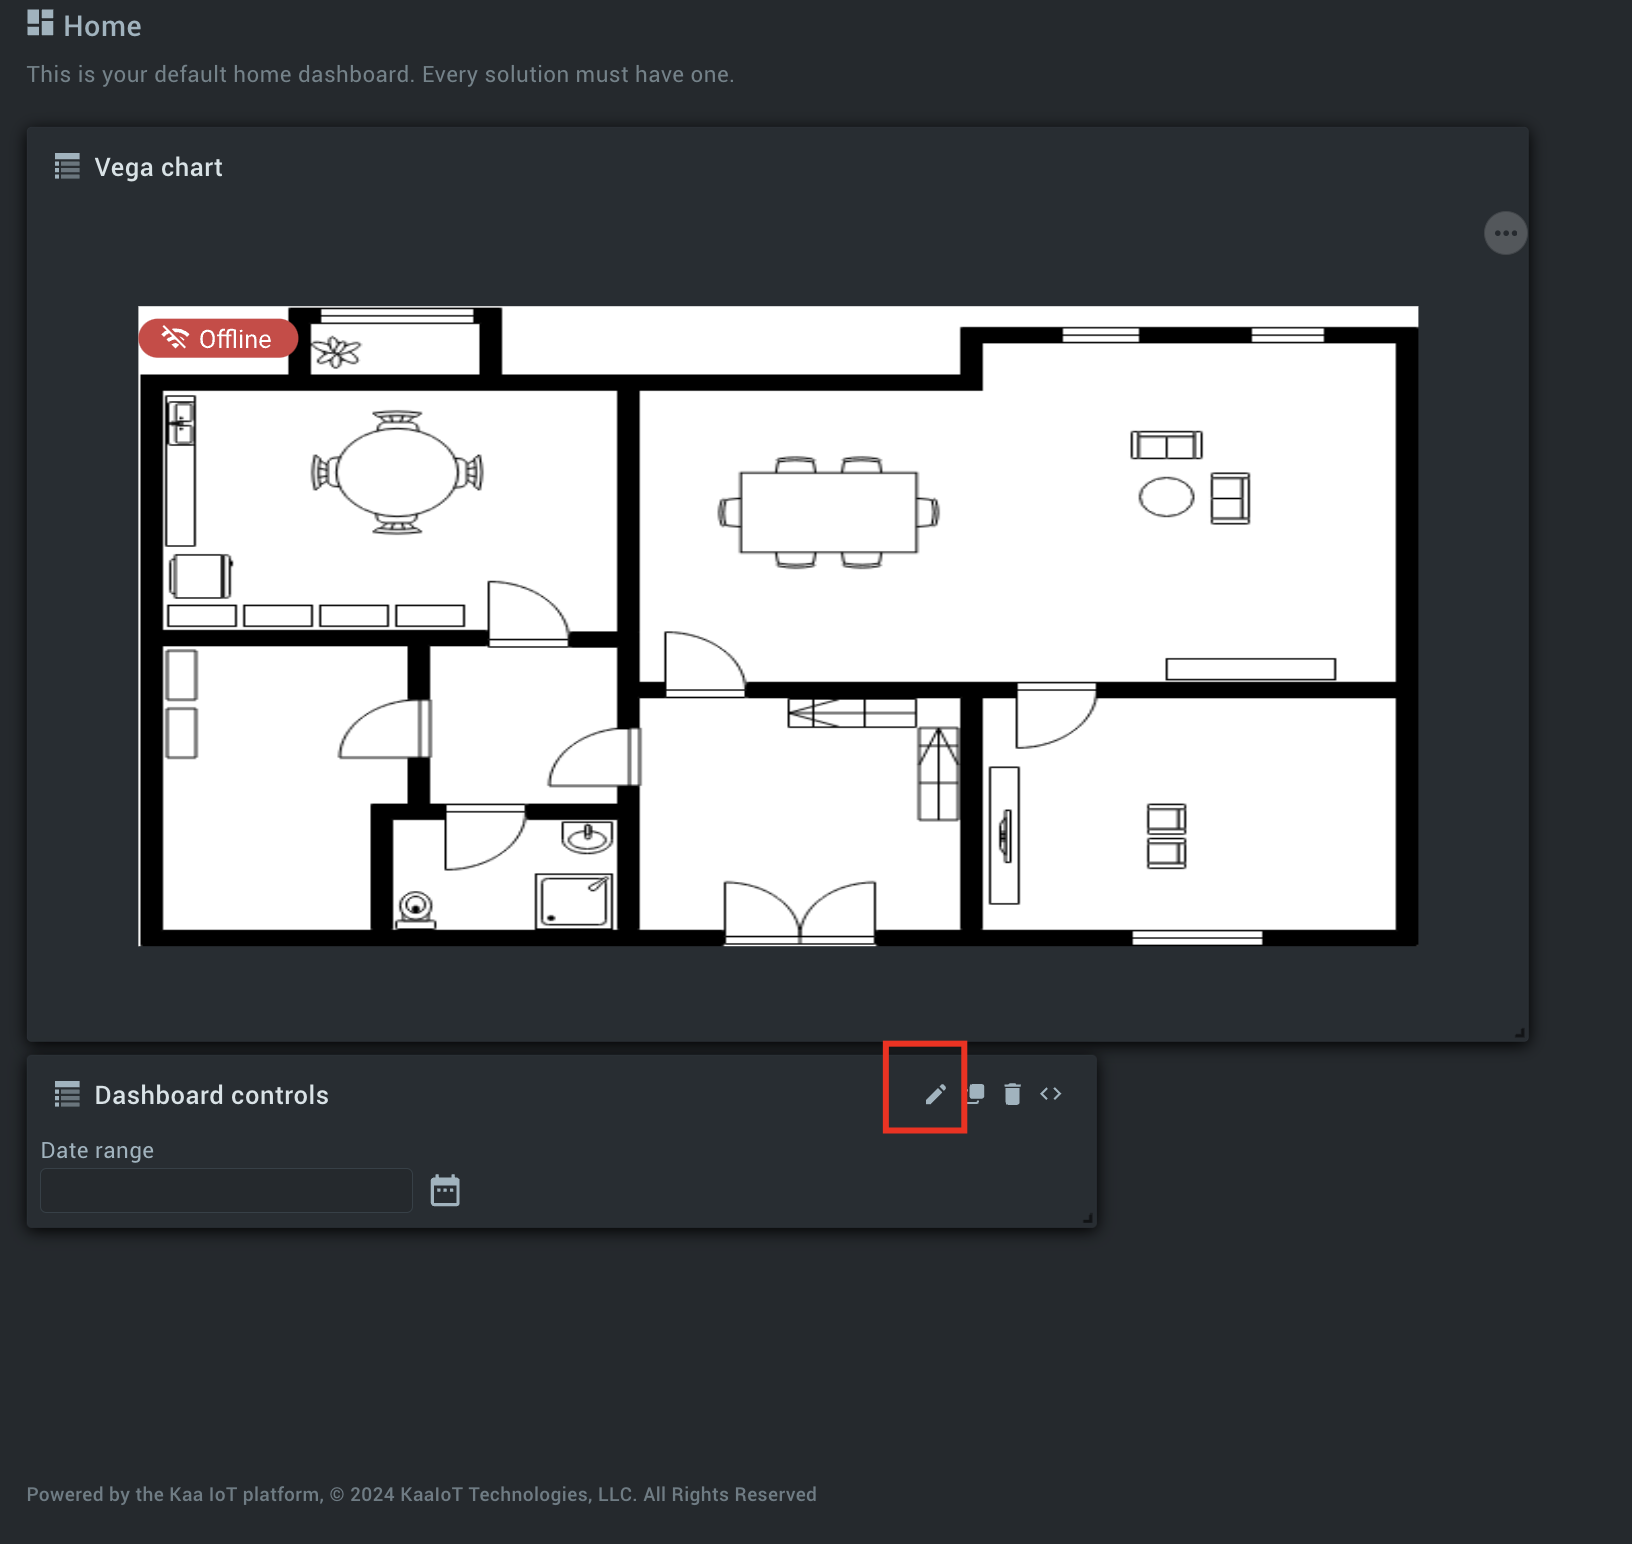
- You will see an edit window for this widget called Edit "Dashboard controls configuration". In this window, we are interested in the Write value by path* text field. The standard value entered in this text box is "range," and we need to replace it with the "endpoint".
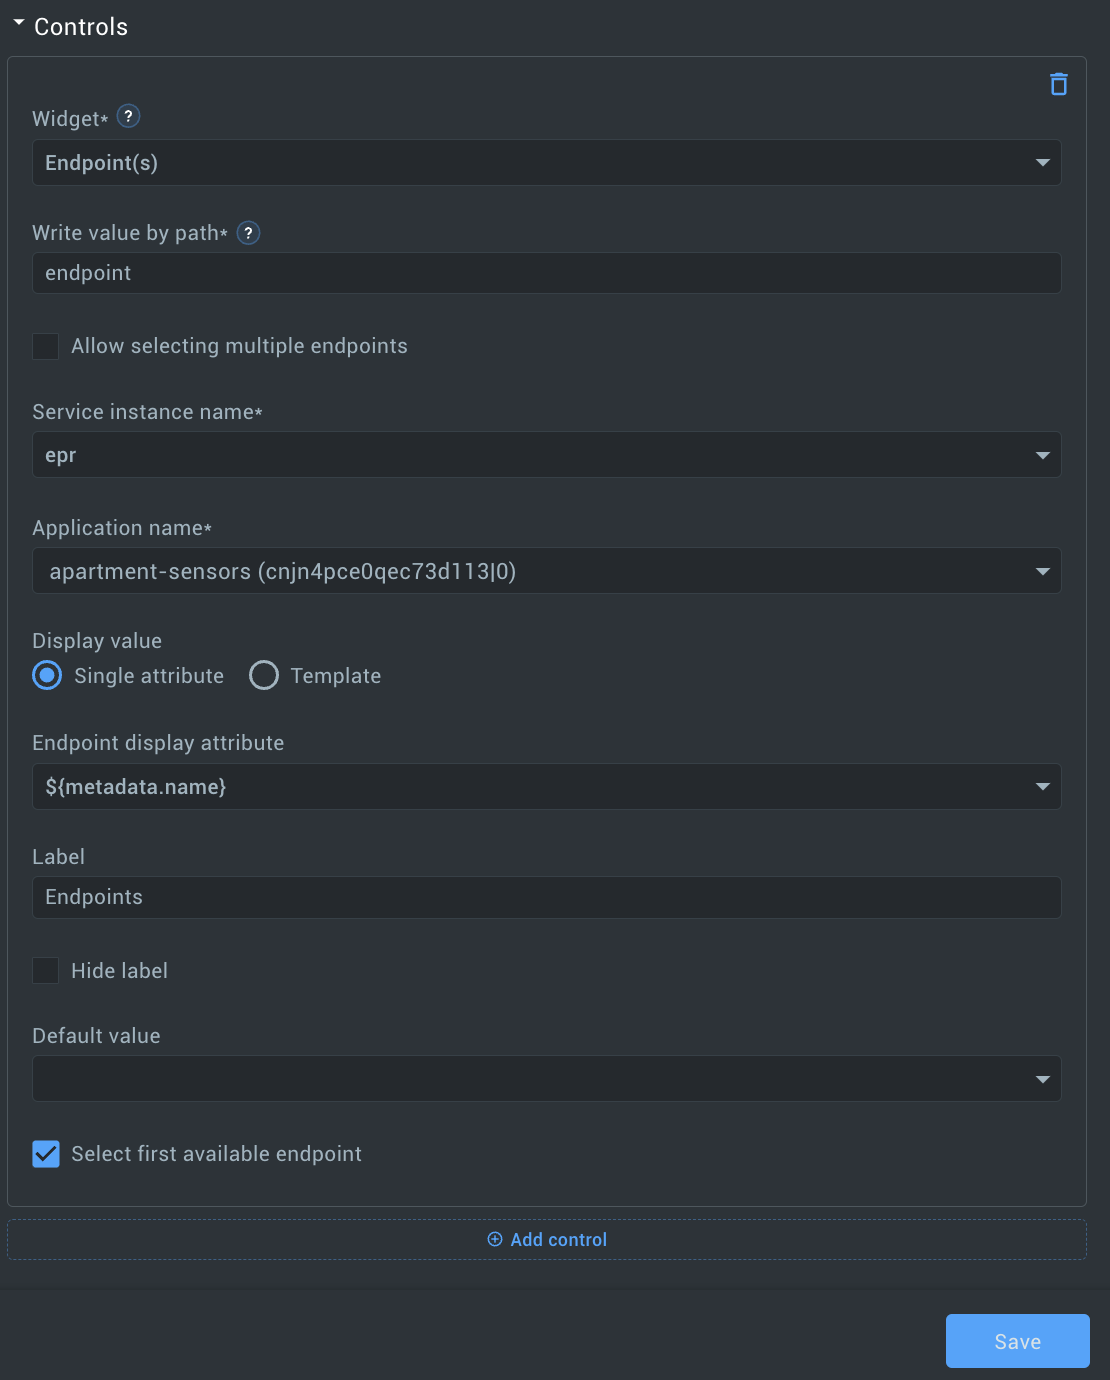
- In the same Controls section, we need to click Add control.
- Select Endpoint(s) for the Widget*.
- Write value by path* - let’s enter endpoint.
- Service instance name* - click on the text box corresponding to this parameter and select the epr option.
- Application name* - select your application with the sensors.
- Next, we need to configure the Endpoint display attribute parameter. Click on the text field corresponding to this parameter and select the option S{metadata. name}.
- Next, configure the Label parameter. In the text box corresponding to this parameter, enter the value Endpoints.
- In the same Controls section, at the end of the list of parameters, check the Select first available endpoint option and click the Save button.
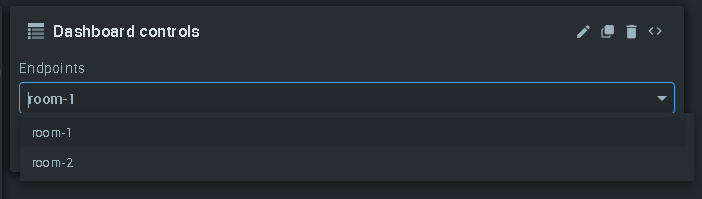
We have a fully functional widget that we will use to quickly switch between our sensors and update their data. If you click on the text field of this widget under the Endpoints parameter, you will open a drop-down menu with which you can select a particular sensor.
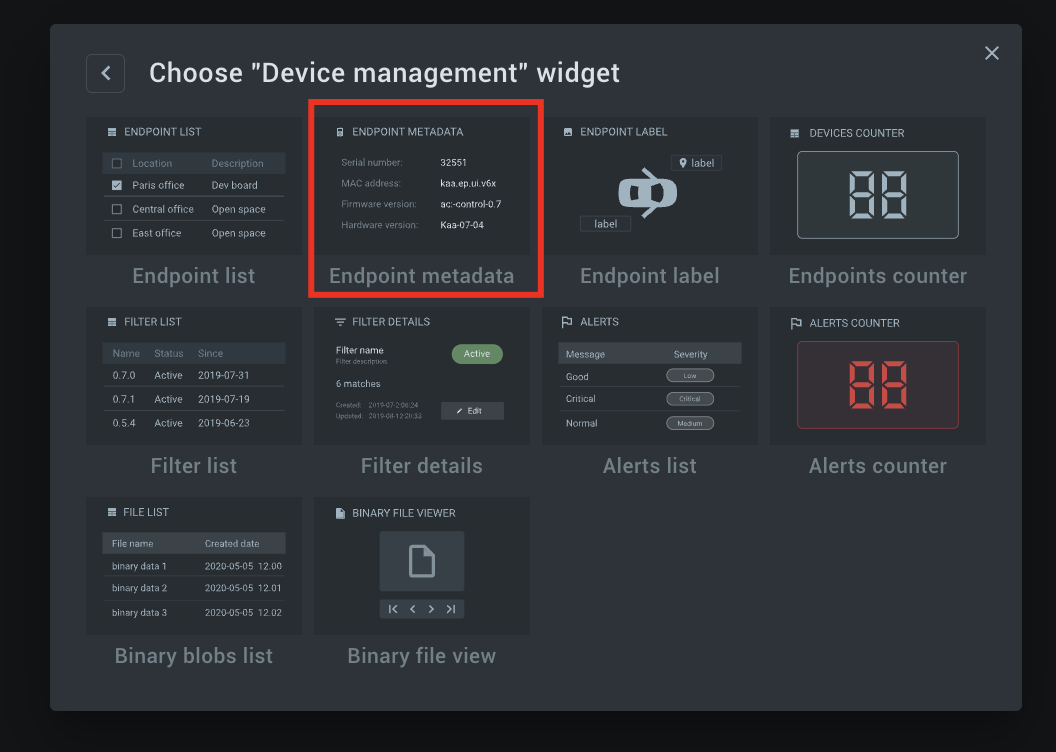
The next step is to add the Endpoint metadata widget, which will also be used to customize the Vega Chart widget. First, we need to add this widget. To do this, follow these steps:
- Click the Add widget.
- Select the Device management section and click on the Endpoint metadata widget.
Great, we've added another widget. You can place it on the dashboard as you like. Now, let's proceed to customize this widget. To do this, we need to follow the steps below:
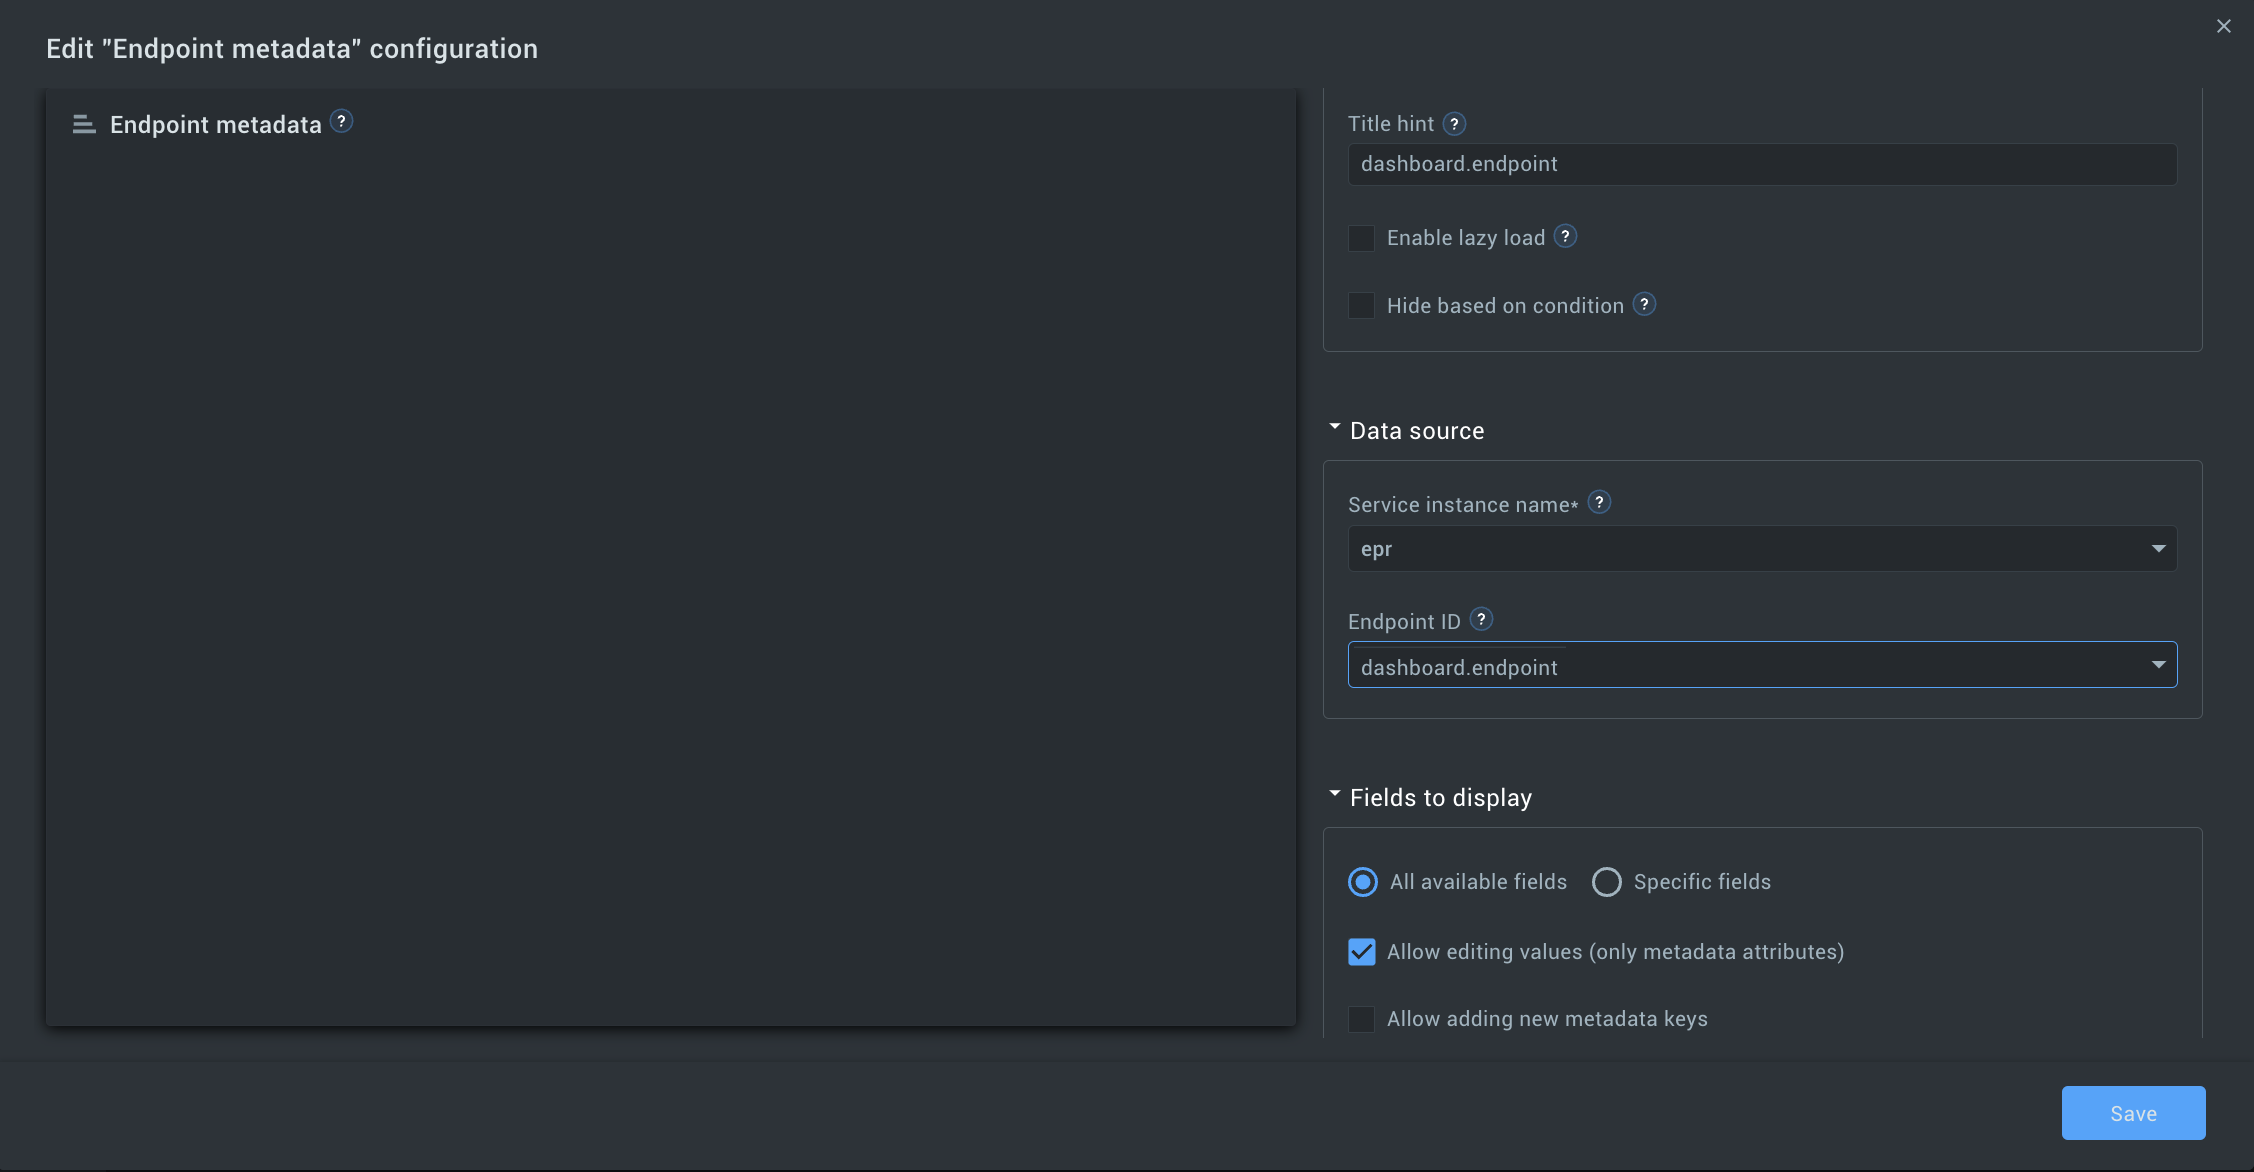
- Click the Edit widget button.
- You need to find a section in the parameters called Data source. In this section, we need a parameter called Endpoint ID. Click on the drop-down menu of this parameter and select the following option: "dashboard.endpoint".
The next step in setting up the Endpoint metadata widget is to bind it to our Dashboard control widget and our sensors. To do this, we need:
- In the Edit "Endpoint metadata" configuration menu, go to the Fields to display parameters, and select the Specific fields option.
- You will see that the content of the Fields to display section in the widget parameters has changed. Click the Add field button.
- In the Metadata key text field, you need to enter the parameter metadata.x. In the Display name text field, you need to write the name that should be displayed on the widget label. In our case, it is "X".
- The next step is to check the Allow editing value option.
Next, you need to repeat the same step for 2 more parameters. Namely:
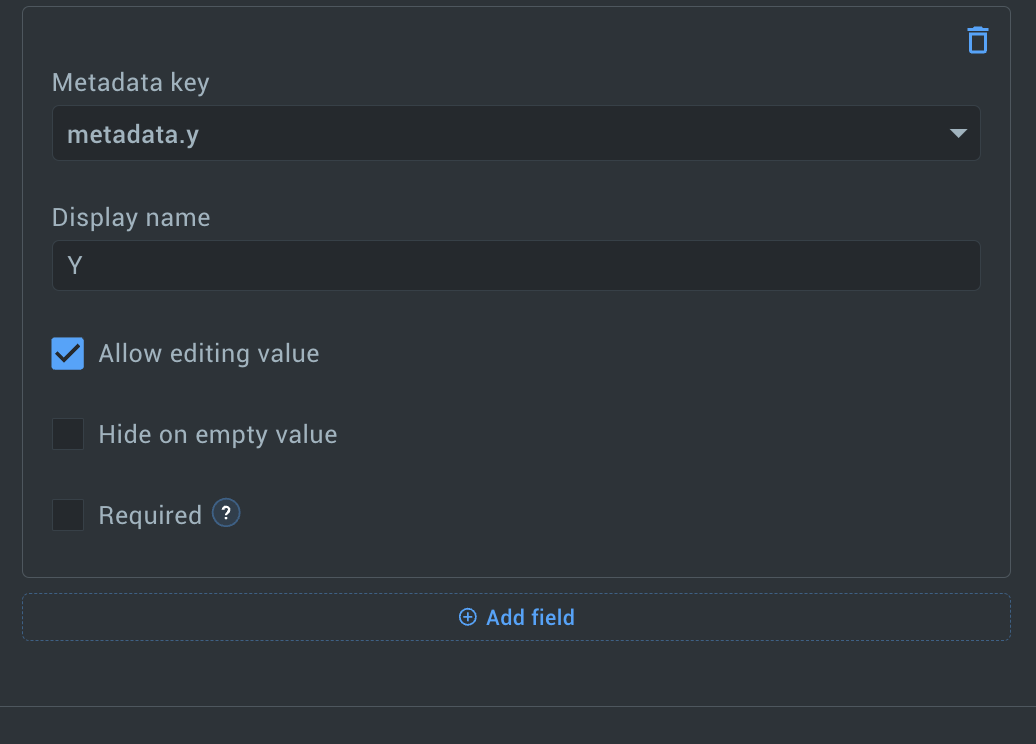
- Click the Add field button.
- In the Metadata key text field that has just appeared, you need to enter the parameter "metadata. y".In the Display name text field, you need to write the name that should be displayed on the widget label. In our case, it is "Y".
- The next step is to check the Allow editing value option.
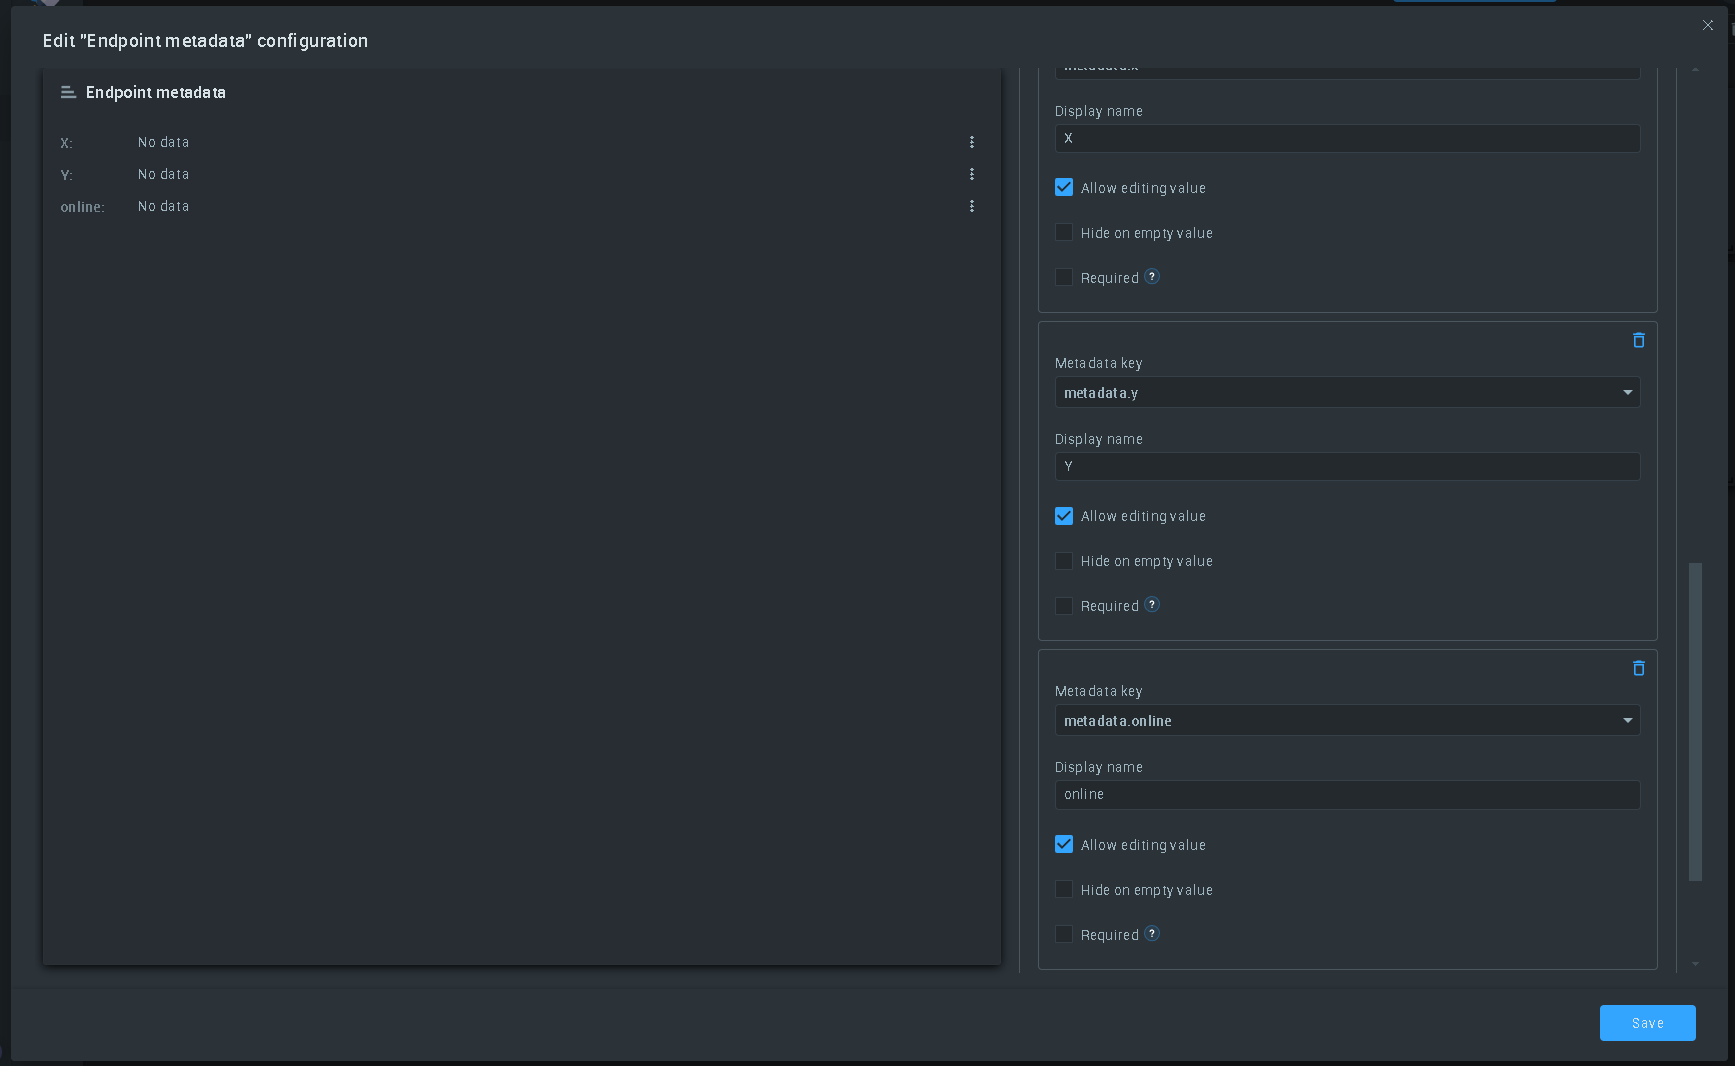
The same algorithm is used to configure the Online parameter. You can do this as follows:
- Click the Add field button.
- In the Metadata key text field that has just appeared, you need to enter the parameter "metadata.online". In the Display name text field, you need to write the name that should be displayed on the widget label. In our case, it is "online".
- The next step is to check the Allow editing value option.
- Click on the Save button.
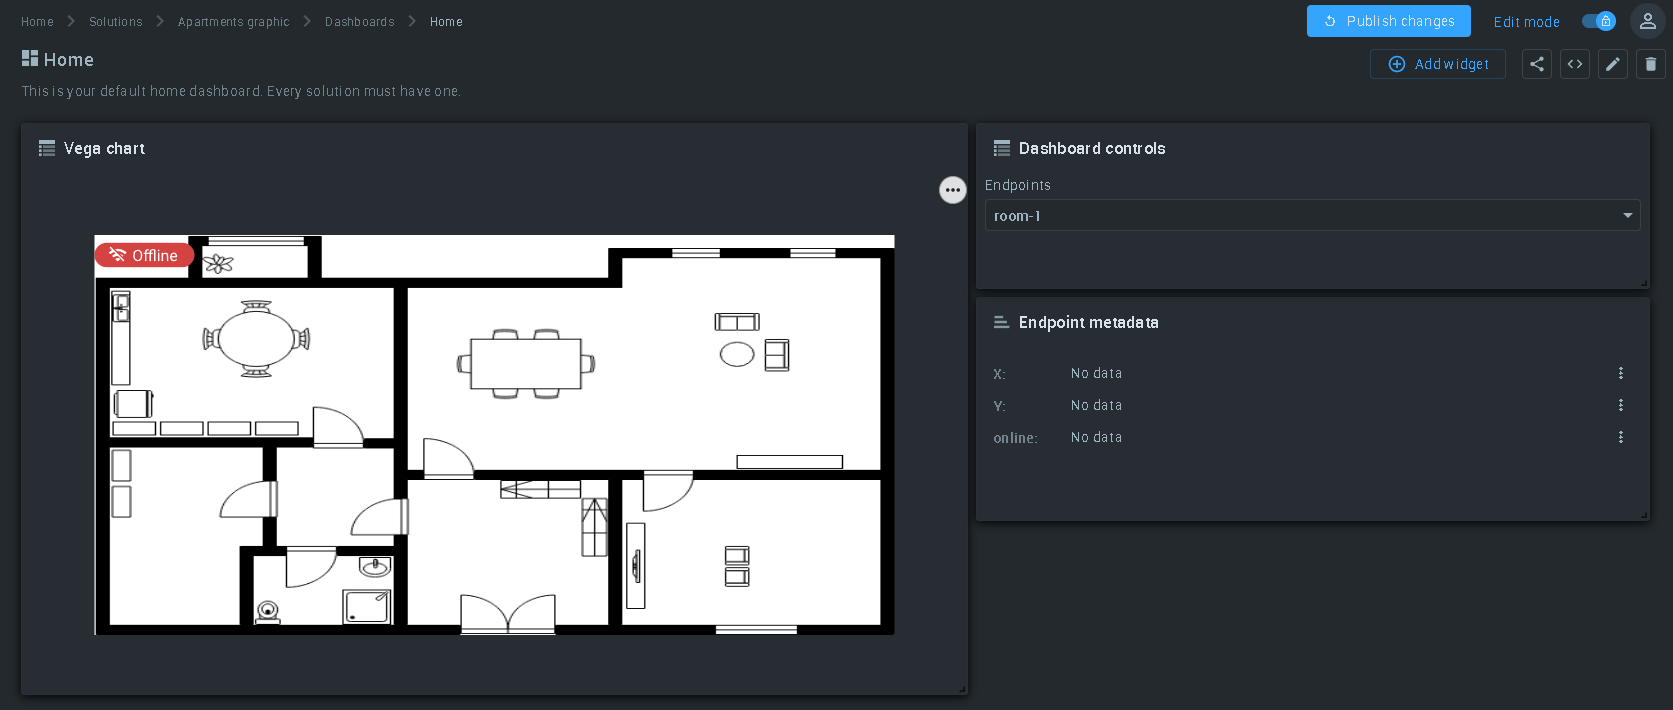
If you did everything right, you will be returned to the dashboard where you added previous widgets (in our case, it's a dashboard called "Home").
#6. Setting the parameters for each sensor
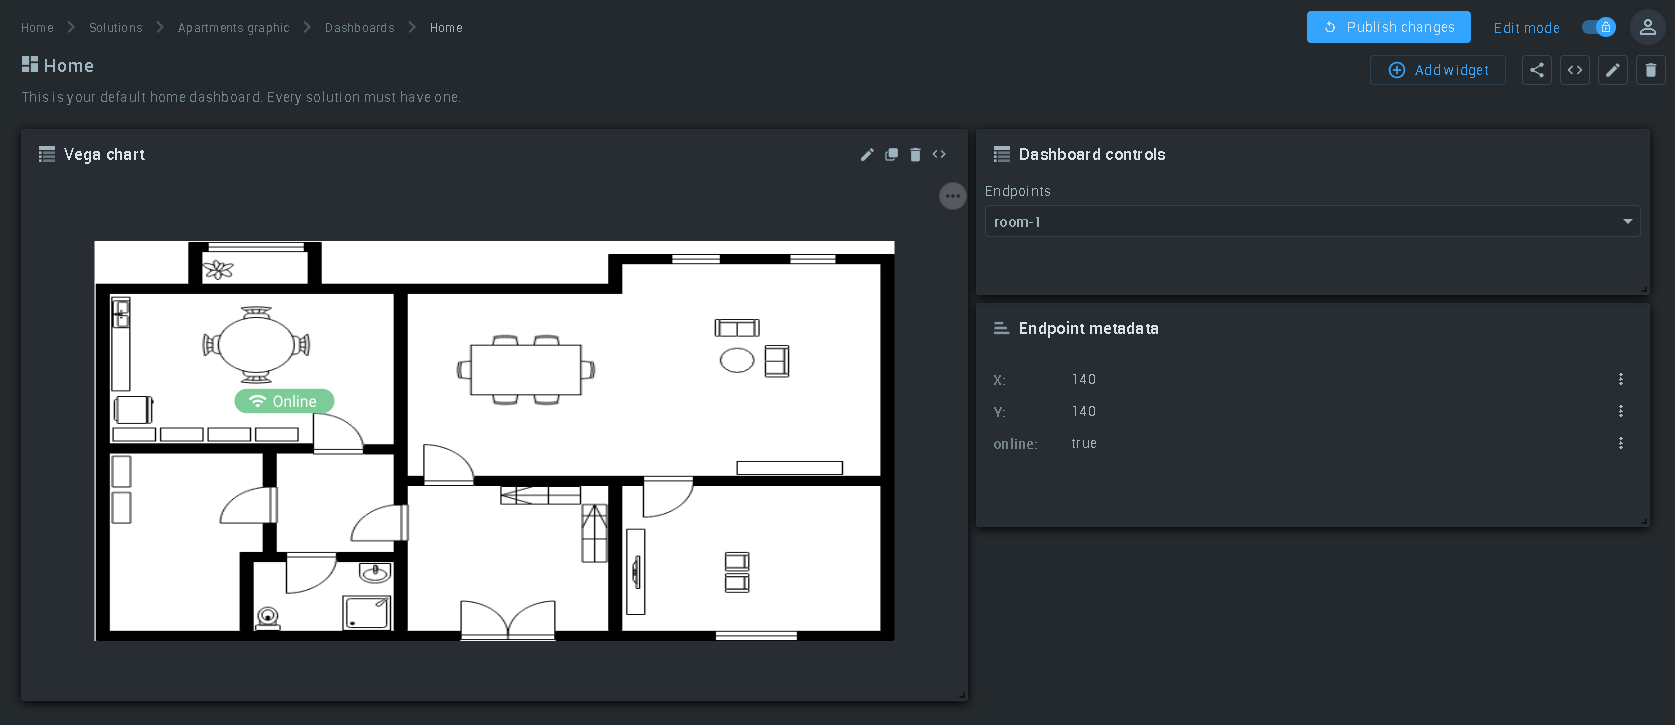
After we have added the Dashboard controls and the Endpoint metadata widgets, we can use them to customize the placement of sensor icons on the floor plan displayed on the Vega Chart widget. First, let's set the coordinates and status for the first sensor. To do this, we need:
- Select the first sensor using the Dashboard controls widget. Just select it from the list in the drop-down menu of this widget. In our case, the first sensor is named "room-1".
- After we have selected the first sensor in the drop-down menu of the Dashboard controls widget, we need to go to the Endpoint metadata widget to set the coordinate values for the first sensor. Click on the text box opposite the "X:" parameter and enter the coordinates you need for the X-axis and then for the Y-axis.
- For demonstration purposes, we have chosen the following values: X = 140, Y = 140. For the online value, we have chosen "true" (note: this widget supports only 2 values for the online parameter: "true" and "false").
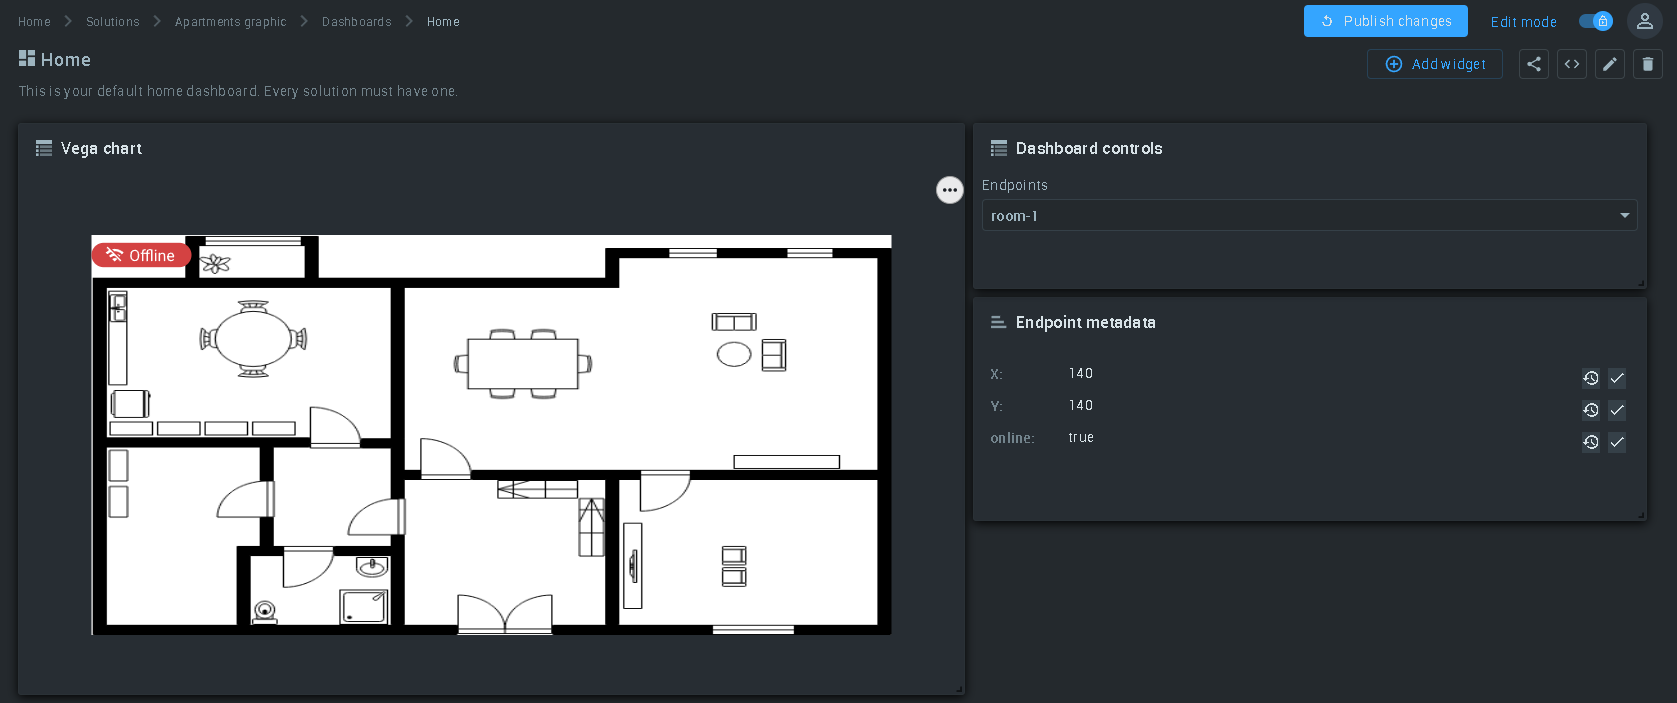
- After you have selected the parameters you need to accept, click on the checkmark buttons, each of which is located opposite its parameter. Immediately after you have accepted a new value for a particular parameter, the changes are displayed on the Vega Chart widget.
You can configure the placement of other sensors on the widget using the same principle. The only thing that will differ in the algorithm when setting up other sensors is the selection of a specific sensor in the drop-down menu of the Dashboard control widget. All changes to the location of the sensor icon that you make through the Endpoint metadata widget are immediately written in the Vega Chart widget code, which you can check yourself.
If you notice, after making changes in the Endpoint metadata widget, it takes some time before the changes are reflected in the Vega Chart widget. If you want the changes to take place with less delay, follow these steps:
- Go to the Vega Chart widget. Click the Edit button.
- In this window, we are interested in the Datasets section. Find the Update interval parameter, and in the 2 text fields below it, select "1" on the left and "seconds" on the right.
- Click the Save button.
Great, now the delay between making changes and displaying them on the widget is 1 second.
Conclusion
This comprehensive tutorial has equipped you with the necessary skills to proficiently showcase apartment floor plans, accurately position sensors on images, and effectively display sensor status. Whether you're an experienced professional or new to this field, the step-by-step guidance provided here ensures clarity and comprehension throughout the process.
By delving into a practical IoT use case, we've demonstrated the seamless integration of floor plan visualization with sensor placement, culminating in the creation of a real-time smart building management dashboard powered by the Kaa IoT platform. This newfound knowledge empowers you to monitor and manage building systems with efficiency and precision.
If you would like to learn more about Kaa Cloud and gain more in-depth skills in working with the Kaa IoT platform, we recommend exploring the Kaa Blog, which contains a lot of useful tutorials. Also, you can read the Kaa Documentation.
Related Stories

KaaIoT and ELSYS join forces to bring robust smart building solutions with real-time climate monitoring.

Exciting news! KaaIoT has teamed up with Roomsys to promote smart building management IoT solutions!

The KaaIoT and Sensative partnership tackles a common challenge: water & oil leaks.

Seeed offers a wide range of IoT hardware products. This article explores how KaaIoT and Seeed are joining...